Published on : 16 Jul 2026
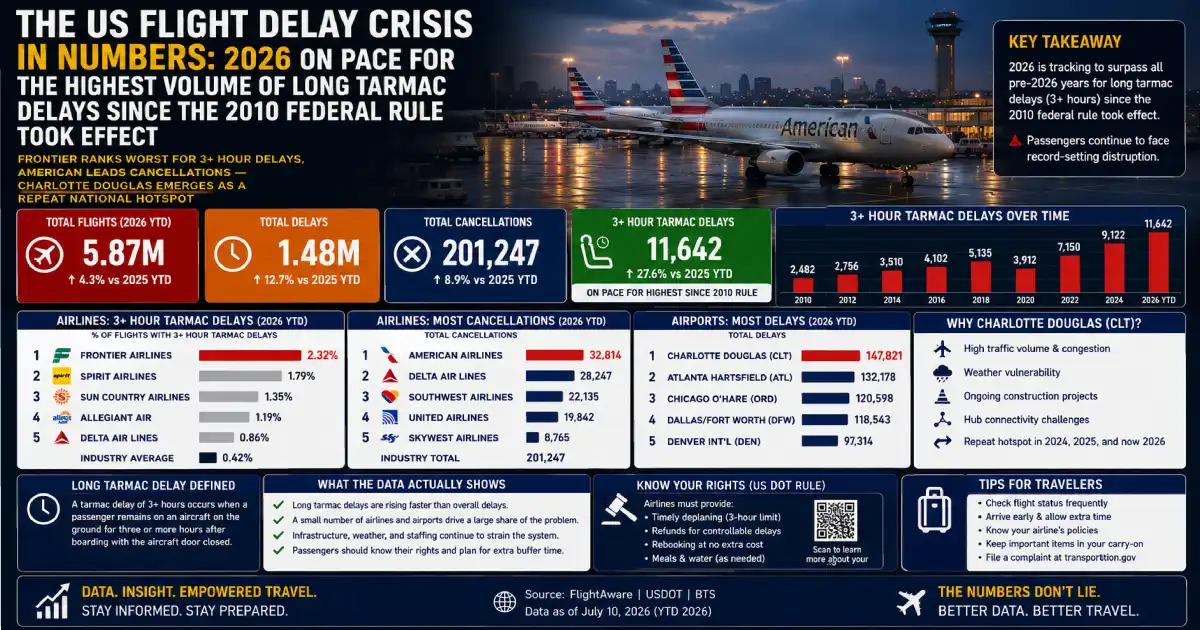
Step back from any single day’s chaos, and a clearer, more troubling picture comes into focus: this isn’t a bad week. It’s a bad year, built on top of an already bad year.
More than a hundred days into an unprecedented US aviation disruption streak, the daily numbers — hundreds of cancellations here, a ground stop there — can start to feel like noise. But the federal data behind those daily headlines tells a consistent, structural story: 2025 delivered the worst on-time performance the US aviation system has seen since 2014, and long tarmac delays — flights held on the ground for three or more hours domestically — hit their highest volume since the federal Tarmac Delay Rule took effect in April 2010. Airlines recorded 708 tarmac delays over three hours on domestic flights in 2025, up 63% from 435 the year before, according to consumer watchdog group U.S. PIRG’s “Plane Truth 2026” report, which draws on Department of Transportation data. Nearly one in four flights — roughly 1.66 million in total — arrived late, was cancelled, or was diverted last year.
Now, halfway through 2026, the pattern shows no sign of reversing. On any given day this month, more than 6,000 flights within, into, or out of the United States have been delayed, with hundreds more cancelled outright — a trend visible across the very disruption reports this site has been tracking daily since April. Beneath the daily churn, two findings stand out for anyone planning summer travel: Frontier Airlines has been identified as the worst-performing major US carrier for flights delayed three or more hours, and Charlotte Douglas International Airport has emerged as one of the system’s most consistent recurring pressure points.
Published: July 16, 2026 — Thursday 2025 on-time performance: Worst since 2014 — roughly 1 in 4 flights delayed, cancelled, or diverted Domestic tarmac delays over 3 hours (2025): 708 — up 63% from 435 in 2024 Historical context: Highest annual tarmac delay total since the Tarmac Delay Rule took effect April 29, 2010 2025 flights cancelled (10 largest carriers): 118,000+ — cancellation rate rose to 5.3%, up from 1.36% in 2024 2025 on-time arrival rate (10 largest carriers): 34%, down from 77.91% in 2024 Worst airline for 3+ hour delays: Frontier Airlines (#1) — Allegiant Air (#2) — American Airlines (#3) Highest 2025 cancellation rate (10 largest): Frontier — 1.77% (2025); rising toward its 2019-2025 average of 2.34% Best on-time performers: Delta, United, Alaska — all around/above 80% on-time, cancellation rates near or below 1.5% Best cancellation record: Hawaiian Airlines — lowest rate among the 10 largest carriers Repeat national hotspot airports (3+ hour delays): Chicago O’Hare (ORD) · Dallas-Fort Worth (DFW) · Philadelphia (PHL) — all with four-figure delayed-flight counts Emerging 2026 hotspot: Charlotte Douglas International (CLT) — repeated multi-hundred-delay days through June and July 2026 FAA peak day: July 9 — 56,000+ scheduled flights, one of the busiest days of the month Southwest’s advantage: Lowest delay rate of major carriers — point-to-point network + single aircraft type (737 only)
The early 2010s saw genuine improvement in US flight reliability, credited partly to the 2010 tarmac delay rule itself, which forces airlines to let passengers deplane during domestic ground delays beyond three hours (and international delays beyond four), backed by fines of up to $27,500 per passenger for violations. That improvement has now visibly reversed. U.S. PIRG’s analysis points to a convergence of factors: persistent air traffic controller shortages, increasingly crowded airspace, airline staffing and scheduling limitations, and a run of severe weather events — from winter storms hitting Washington, New York, Atlanta, and Dallas in early 2025 to the thunderstorm-heavy summer pattern now driving this site’s daily disruption coverage.
One additional factor specific to 2025’s numbers: American Airlines cited the prolonged US government shutdown in the fourth quarter of 2025 as a driver of mandatory schedule reductions and depressed bookings, in its own February 2026 financial filings — a reminder that flight reliability data reflects policy and macroeconomic shocks as much as weather and mechanical issues.
Analysts reviewing the tarmac delay spike specifically point to a operational pattern: at peak times, when bad weather, air traffic restrictions, or runway closures create a bottleneck and gates aren’t available, carriers sometimes choose to keep passengers on board hoping for a quicker resolution — a strategy that increasingly backfires when disruptions run longer than expected.
Two different metrics tell two related but distinct stories, and it’s worth understanding the difference before booking your next flight.
Cancellation rate measures how often an airline cancels a flight outright. Here, American Airlines topped the list in 2025 at a 1.82% cancellation rate — and is on pace to do so again in 2026, with roughly 3% of its flights cancelled so far this year. Frontier followed closely in 2025 at 1.77%, though that was actually an improvement on its 2019-2025 average of 2.34%. JetBlue has posted the sharpest 2026 deterioration, jumping to a 3.14% cancellation rate in the first half of the year — the highest among the eight major carriers analyzed by BTS data, up from 1.65% in 2025.
Long-delay rate (3+ hours) measures a different failure mode: how often your flight actually happens, just very late. This is where Frontier ranks worst overall, followed by Allegiant Air and American Airlines, according to AirAdvisor’s ranking of major US carriers. Frontier’s own on-time performance sat at just 70.68% in 2025, with “aircraft arriving late” cited as the most common cause — a chain-reaction pattern where one delayed inbound flight pushes back the next departure. That figure has been consistently in the 60s since 2022.
Best performers by both measures: Delta and United report on-time arrival rates around or above 80% in recent months with cancellation rates near or below 1.5%. Southwest posts the lowest delay rate of any major carrier — AirAdvisor attributes this to its point-to-point network structure (rather than a hub-dependent model where one delay cascades through connections) and its single-aircraft-type fleet, meaning any spare 737 or crew can cover a disrupted flight without needing to match a specific aircraft type.
Three airports consistently top the list for long delays: Chicago O’Hare, Dallas-Fort Worth, and Philadelphia — all recording four-figure numbers of 3+ hour delayed flights in AirAdvisor’s most recent annual ranking, and all disproportionately American Airlines hubs. Industry analysts point to weather exposure as the common thread: Philadelphia and Chicago face East Coast and Midwest storm risk from both summer thunderstorms and winter snow, while DFW’s Texas location brings its own severe thunderstorm pattern — visible in this site’s own coverage of DFW disruption days throughout June and July.
Charlotte Douglas International Airport has emerged as a distinct and increasingly persistent hotspot through the 2026 summer season specifically. Across multiple disruption events this site has tracked in June and July, Charlotte has repeatedly recorded disruption in the 130–300 delay range on individual days, frequently pulling in American Airlines and its regional partners PSA Airlines and Piedmont Airlines simultaneously — a pattern that reflects Charlotte’s role as one of American’s most tightly scheduled regional connecting hubs, where a single disruption ripples across dozens of short connecting flights at once.
A structural factor compounding all of this: FAA labor rules impose strict legal limits on how many consecutive hours pilots and flight attendants can work, meaning airlines have little flexibility to simply “push through” a delay once crews approach their duty-time limits — a single weather delay or air traffic slowdown can cascade through an entire day’s schedule with almost no margin for recovery.
If you’re choosing between airlines for a similar route: Delta, United, and Southwest currently offer the most reliable combination of low cancellation rates and low long-delay rates. If your itinerary allows flexibility, these carriers carry statistically lower risk of a multi-hour disruption this summer.
If you’re flying Frontier, Allegiant, or American: Build in extra buffer time, especially for connecting itineraries, and strongly consider booking the earliest flight of the day on any given route — delays compound as the day progresses, so morning departures carry meaningfully lower risk of inheriting a late-arriving aircraft from earlier in the schedule.
If your route passes through O’Hare, DFW, Philadelphia, or Charlotte Douglas: Treat these as elevated-risk connections regardless of which airline you’re flying, given how frequently this site has documented three-figure-plus disruption days at each of these hubs throughout 2026.
Know your tarmac delay rights: Under the 2010 federal rule, domestic airlines must give you the opportunity to deplane once a tarmac delay reaches three hours (four hours for international flights), with limited exceptions for safety or security. If you experience a tarmac delay approaching this threshold, ask crew directly about your deplaning rights.
Regardless of cause, any cancelled flight entitles you to a full refund to your original payment method if you decline rebooking.
Applies only when the airline’s own operational choices — not weather — caused a delay of 3+ hours. Ask for the specific stated cause in writing.
Domestic flights: right to deplane after 3 hours. International flights: right to deplane after 4 hours. Airlines face fines of up to $27,500 per passenger for violations.
Get the cause in writing → file with the airline first → escalate to airconsumer.dot.gov if unresolved.
Related Articles:
Posted By : Vinay
This article is provided for general informational purposes only and is based on information available at the time of publication. Travel advisories, airline schedules, airport operations, visa requirements, government regulations, and other travel-related information are subject to change without prior notice. While Travel Tourister makes reasonable efforts to verify information using official announcements, government publications, airline and airport communications, and other reliable sources, we cannot guarantee that all information remains complete, accurate, or up to date at all times. Readers should independently verify any information that may affect their travel plans with the relevant airline, airport authority, government agency, embassy, or other official source before making travel, financial, or other decisions. Travel Tourister shall not be liable for any direct or indirect loss, inconvenience, or damages arising from the use of or reliance on the information contained in this article. Nothing in this publication constitutes legal, immigration, financial, or professional travel advice. If you believe any information in this article is inaccurate or outdated, please contact our editorial team. We review all credible correction requests promptly and update our content whenever appropriate.
Lastest News
2nd Floor, 39, Above Kirti Club, DLF Industrial Area, Kirti Nagar, New Delhi, Delhi 110015



Travel Tourister is a leading Travel portal where we introduce travellers to trusted travel agents to make their journey hasselfree, memorable And happy. Travel Tourister is a platform where travellers get Tour packages ,Hotel packages deals through trusted travel companies And hoteliers who are working with us across the world. We always try to find new and more travel agents and hoteliers from every nook and corners across the world so that you could compare the deals with different travel agents and hoteliers and book your tour or hotel with the one you have chosen according to your taste and budget.
Copyright © Travel Tourister, India. All Rights Reserved

 Call
Call Enquiry