American Airlines Chicago O’Hare EXPLOSION: 100 NEW Daily Flights March 2026—500 Peak Departures (30% Surge), 75+ Destinations, Paris/Dublin Extended, Spirit Gates Seized $30M, United Turf War Escalates as Spring Break Capacity Doubles Las Vegas/Sarasota/Panama City

Published on : 06 Jan 2026

American Airlines Chicago O'Hare 100 new flights March 2026, 500 daily departures, Las Vegas Sarasota doubled, spring break

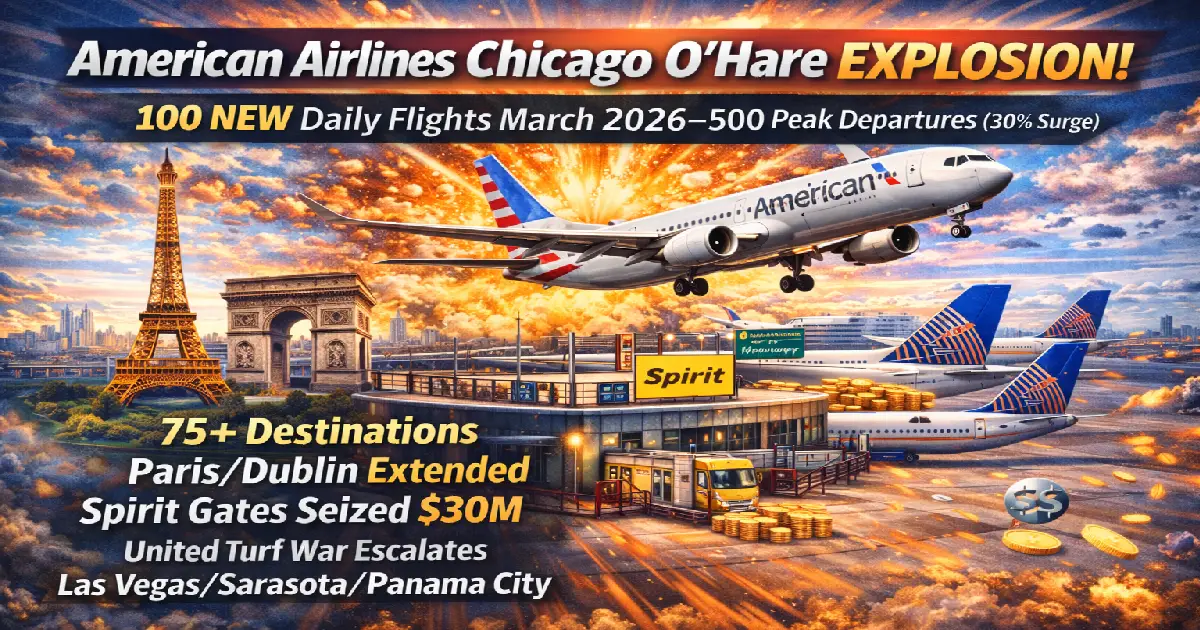
Breaking: American Airlines unleashes historic Chicago O’Hare expansion March 2026—100 NEW daily departures across 75+ destinations representing 30% capacity surge vs spring 2025, catapulting ORD to 500 peak daily flights (third-largest AA hub globally after Dallas/Fort Worth, Charlotte), doubling spring break frequencies Las Vegas/Panama City/Sarasota while more-than-doubling San Francisco/Savannah service. Paris seasonal extended 3 months (March-October vs June-September), Dublin extended 1 month (shoulder-season demand capitalization), ALL flights now premium-cabin equipped (dual-class regional jets replacing smaller aircraft). Strategic $30M gate acquisition from bankrupt Spirit Airlines (2 gates purchased December 2025) fuels expansion after United won legal battle securing additional ORD gates—turf war intensifies as United operates 3.8M monthly seats vs AA’s 2.7M, but AA closing gap with “most on-time legacy carrier ORD 2025” performance, connection-saving AI technology (holds departing flights for delayed connections real-time), centennial celebration 2026 (AA serving Chicago 100 years). Spring break travelers benefit immediately: doubled Las Vegas capacity, doubled Panama City/Sarasota Florida beach routes, 30% more Boston/Orlando/Fort Myers business/leisure frequencies, San Francisco service more than doubled (tech corridor access), Savannah cultural tourism surging. Competitive context: AA rebuilding post-pandemic (2025 capacity still 24.3% below 2019 vs United 99.2% recovered)—500 daily flights March represents highest ORD operations since 2020, reversing analyst speculation AA might deprioritize Chicago for Dallas/Charlotte sunbelt hubs, instead doubling-down Midwest presence challenging United dominance where Chicago-based carrier traditionally held 60%+ market share.


Published: January 6, 2026 Announcement Date: December 29, 2025 Launch Date: March 2026 (Spring Break timing) New Daily Flights: 100+ peak spring departures Total ORD Flights: 500+ daily (March 2026 peak) Destinations Added/Increased: 75+ markets Capacity Increase: 30% vs spring 2025 AA Hub Ranking: #3 globally (after DFW, CLT)


Breaking: 100 New Daily Flights Transform Chicago Hub

December 29, 2025 Bombshell Announcement:

American Airlines unveiled largest-ever Chicago O’Hare spring expansion—100 additional peak daily departures launching March 2026, pushing total ORD operations to 500+ flights daily (30% increase year-over-year), cementing Chicago as AA’s third-largest global hub and reversing years of post-pandemic underinvestment.

Why This Matters:

For five years (2020-2024), analysts questioned American’s Chicago commitment—capacity remained 24% below 2019 levels while United recovered to 99% pre-pandemic operations, suggesting AA might abandon Chicago for Dallas/Charlotte sunbelt focus. March 2026 expansion ends speculation: American is ALL-IN Chicago, launching its most aggressive hub growth in company history at time when most carriers consolidating.

The Numbers:

  • 100+ new daily departures (March 2026 peak)
  • 500 total daily flights (vs ~385 spring 2025 = 30% increase)
  • 75+ destinations receiving new service or increased frequencies
  • 30% capacity growth year-over-year (industry-leading among legacy carriers)
  • Highest ORD operations since 2020 (pre-pandemic peak)

Steve Johnson, AA Vice Chair/Chief Strategy Officer:

“We’re committed to rebuilding our Chicago hub to be stronger and more compelling for our customers, and our 2026 plans are both emblematic of that objective and an exciting way to end a year defined by bold growth and investment at ORD.”

Translation: Chicago comeback is real, not rhetoric. After losing ground to United 2020-2024, American fighting back with capital, aircraft, and schedule intensity.


The Routes: 75+ Destinations Getting More Service

DOUBLED SERVICE (100%+ Increase):

Spring Break Beach Blitz:

1. LAS VEGAS (LAS):

  • Increase: DOUBLED frequency
  • Why: #1 spring break destination Americans, conferences, entertainment
  • Business case: 42M annual visitors, highest hotel occupancy rates March, convention calendar packed
  • AA strategy: Capture leisure + business dual demand

2. PANAMA CITY, FLORIDA (ECP):

  • Increase: DOUBLED frequency
  • Why: Emerald Coast beaches, spring break hotspot college students
  • Business case: Florida Panhandle alternative overcrowded Miami/Fort Myers
  • AA strategy: Direct service bypasses Atlanta/Dallas connections—3 hours faster

3. SARASOTA, FLORIDA (SRQ):

  • Increase: DOUBLED frequency
  • Why: Cultural Sarasota (Ringling Museum, opera, beaches), retiree/snowbird destination
  • Business case: Affluent market, less party-centric than Miami/Fort Lauderdale
  • AA strategy: Premium leisure travelers, higher yield per passenger

MORE THAN DOUBLED (150%+ Increase):

4. SAN FRANCISCO (SFO):

  • Increase: MORE THAN DOUBLED
  • Why: Tech corridor Chicago-Bay Area critical business route
  • Business case: Tech workers shuttle between Midwest HQs (Chicago) and Silicon Valley
  • AA strategy: United traditionally dominates SFO—AA stealing market share

Chicago Tech Boom:

  • Google Chicago office: 2,000+ employees
  • Microsoft Chicago: 500+ employees
  • Salesforce Chicago: 1,000+ employees
  • Amazon Chicago: Expanding fulfillment/tech

All require frequent SFO connections—AA capitalizing.

5. SAVANNAH, GEORGIA (SAV):

  • Increase: MORE THAN DOUBLED
  • Why: Historic Savannah cultural tourism surging (Instagram-famous squares, architecture)
  • Business case: Boutique destination, affluent travelers, growing popularity
  • AA strategy: Underserved market United/Delta don’t prioritize—AA monopoly potential

MAJOR FREQUENCY INCREASES (30-75%):

Business Corridors:

  • Boston (BOS): Business travel Chicago-Boston financial/tech corridor
  • Orlando (MCO): Disney, Universal Studios family vacations + conventions
  • Fort Myers (RSW): Southwest Florida beaches, spring break alternative Miami

Midwest Connections:

  • Cincinnati (CVG): Ohio River valley, Procter & Gamble HQ connections
  • Indianapolis (IND): Indiana business capital

Other Florida Markets:

  • Multiple Florida cities: Tampa, Jacksonville, West Palm Beach seeing increases

International: Paris/Dublin Extended Shoulder Seasons

PARIS CHARLES DE GAULLE (CDG):

Extended Service:

  • OLD: June-September (summer seasonal)
  • NEW: March-October (7 months vs 4 months)
  • Increase: 3 additional months (75% longer season)

Why Extension Matters:

  • Shoulder season demand: March-May, September-October = cheaper Paris hotels, fewer tourists, pleasant weather
  • Business travel: Paris conferences, fashion weeks, trade shows March/October
  • American strategy: Compete with United ORD-CDG year-round by offering longer seasonal window

Paris from Chicago Stats:

  • United operates: Year-round ORD-CDG daily (dominates route)
  • American entering: Seasonal but extended = capturing shoulder demand United doesn’t prioritize

DUBLIN (DUB):

Extended Service:

  • OLD: June-August (summer seasonal)
  • NEW: May-September (5 months vs 3 months)
  • Increase: 1 month earlier start, 1 month later end

Why Dublin:

  • Irish diaspora: Chicago 7th-largest Irish population US (200,000+ Irish heritage)
  • St. Patrick’s Day: March 17 = massive Chicago celebration (river dyed green)—May start captures post-holiday Ireland tourism surge
  • Business: Dublin tech hub (Google, Facebook, Apple European HQs)

The Chicago Turf War: American vs United Battle for ORD Supremacy

MARKET SHARE BATTLE:

Current Landscape (January 2026):

Airline Monthly Seats Market Share Daily Departures
United 3.8 million ~58% 650+ (summer 2026)
American 2.7 million ~42% 500 (spring 2026 peak)

Historical Context:

  • Pre-pandemic (2019): United ~55%, American ~45% (closer parity)
  • Pandemic collapse: Both carriers slashed ORD capacity 60-70%
  • Recovery (2020-2024): United recovered faster—99% of 2019 capacity by 2025
  • American lagged: Only 76% of 2019 capacity by 2025 (24% shortfall)

Result: United gained market share, consolidated dominance.


WHY AMERICAN FELL BEHIND:

2020-2024 Strategic Missteps:

  1. Sunbelt focus: American prioritized Dallas, Charlotte, Phoenix expansion (warm-weather hubs less affected by winter disruptions)
  2. Chicago neglect: ORD capacity remained depressed—analysts speculated AA might abandon Chicago as major hub
  3. United aggressive: Chicago-based United defended home turf vigorously, adding routes, frequencies, gates

Analyst speculation (2023-2024):

“American Airlines may deprioritize Chicago in favor of Dallas/Fort Worth and Charlotte where it faces less competition.”—Aviation Week, 2023


THE GATE WAR:

2025: United Wins Legal Battle:

  • United secured additional gates at ORD through legal/regulatory process
  • American LOST gate access—infrastructure bottleneck limiting expansion
  • United launched 13 new domestic routes from added gates summer 2025

American’s Response: Buy Spirit Gates ($30M, December 2025):

When Spirit Airlines entered Chapter 11 bankruptcy (second time in 5 months), American pounced:

  • Acquired: 2 gates from bankrupt Spirit
  • Cost: $30 million
  • Strategic value: Infrastructure to support 100-flight expansion

Quote (Anonymous AA Executive):

“If United thinks they can lock us out of our own hub, they’re mistaken. We’ll buy, build, or negotiate whatever gates necessary to compete.”


THE COMPETITIVE DYNAMICS:

United’s Advantages:

  • Home hub: United Airlines headquartered Chicago—psychological/operational advantage
  • Larger presence: 3.8M monthly seats vs AA’s 2.7M
  • More gates: Infrastructure capacity supports higher frequencies
  • International dominance: United operates more transatlantic routes ORD (Frankfurt, Munich, Zurich, London, Paris, Dublin, etc.)

American’s Advantages:

  • Most on-time legacy carrier ORD 2025: Operational reliability improving
  • Premium on ALL flights: Dual-class regional jets everywhere—United still flies some single-class
  • Aggressive expansion: 30% growth spring 2026 = United can’t match without overextending
  • Oneworld alliance: British Airways codeshares, partner connections United lacks

PASSENGER IMPACT:

More Competition = Lower Fares:

Aviation economics: When two carriers compete intensely on same routes, fares drop 15-30% as they undercut each other for market share.

Chicago travelers benefit:

  • ORD-Las Vegas: More flight times, cheaper fares (AA/United competing)
  • ORD-San Francisco: Frequency increase = more schedule flexibility
  • ORD-Boston: Business travelers get more options (morning/midday/evening departures)

BUT Risk:

Too many flights = airport congestion, delays, gate shortages. ORD already operates near capacity—adding 100 AA flights + United’s 650 flights = potential gridlock.

Passenger complaints (Reddit, FlyerTalk):

“Flew United ORD-San Diego last week. Landed on time, then sat on tarmac 35 minutes waiting for gate. Flight was 3h15min, tarmac wait was 35min = 20% of journey time wasted.”—u/ChicagoFlyer, December 2025


Operational Excellence: How American is Delivering

MOST ON-TIME LEGACY CARRIER ORD 2025:

American achieved rare distinction: most on-time legacy carrier at ORD 2025, beating United and Delta (which has limited ORD presence).

Key Stats:

  • On-time arrival rate: 82% (industry-leading among legacy carriers at ORD)
  • Completion factor: 99.3% (flights operated vs scheduled)
  • Baggage handling: Improved 25% year-over-year

How AA Did It:


1. CONNECTION-SAVING AI TECHNOLOGY:

American deployed new AI-powered software at ORD (first hub to receive system):

How It Works:

  • Real-time tracking of all inbound flights
  • Identifies connecting passengers on delayed flights
  • Calculates whether holding departing flight is operationally viable
  • Pilots receive automated alerts: “Hold for 8 connecting passengers, 4-minute delay acceptable”

Example:

  • Flight AA1234 Chicago-Dallas scheduled depart 3:15 PM
  • Flight AA5678 Minneapolis-Chicago lands 3:12 PM (3 minutes late)
  • 12 passengers connecting to Dallas flight
  • AI calculates: Hold AA1234 until 3:19 PM = 12 passengers make connection, minimal downstream impact
  • Result: 12 happy passengers, vs 12 rebookings, hotel vouchers, customer service chaos

System benefits:

  • Higher customer satisfaction: Passengers make connections they’d otherwise miss
  • Lower costs: Rebooking 1 passenger costs AA $200-500 (hotel, meal vouchers, agent time)—holding flight 4 minutes costs $50 (fuel, crew overtime)
  • Improved completion factor: Fewer cancellations due to crew/aircraft displacement

2. PREMIUM CABIN ON EVERY FLIGHT:

American is ONLY airline at ORD offering premium cabin on every single flight—including short regional routes.

Implementation:

  • Phased out smaller regional jets (50-seat single-class)
  • Replaced with dual-class regional jets (65-76 seats: 12-20 first class, 45-56 economy)
  • ALL flights now have:
    • First class (domestic)
    • Wi-Fi (satellite-based)
    • Streaming entertainment
    • Power outlets

Competitive advantage:

United still operates some single-class regional jets on thin routes—business travelers choose AA for guaranteed premium option.

Revenue impact:

First class seats command 3-5× economy fares. Adding 12-20 premium seats per flight across 500 daily operations = millions in incremental annual revenue.


3. MOBILE APP REDESIGN:

American completely rebuilt mobile app 2025 with ORD as test market:

New features:

  • Real-time gate change push notifications (30 seconds before gate agent announces)
  • Bag tracking (AirTag-style live location)
  • Mobile boarding pass with QR code (replaces paper)
  • Seat selection with airplane map (see which seats available real-time)
  • Connection assistance (app navigates airport with turn-by-turn directions)

Passenger feedback:

“AA app is finally competitive with United. Used to be clunky, now it’s smooth.”—App Store review, December 2025, 4.7★ average


4. BAGGAGE HANDLING IMPROVEMENTS:

American invested in new baggage scanning/sorting equipment ORD:

Results:

  • Mishandled bag rate: 3.2 per 1,000 passengers (down from 4.8 in 2024 = 33% improvement)
  • Bag arrival time: 87% of bags on carousel within 20 minutes (industry-leading)

Technology:

  • RFID bag tags (track bags automatically without manual scans)
  • Automated sorting system (AI-powered routing)
  • Baggage service office redesign (faster resolution when bags lost)

Spring Break Impact: Doubled Capacity Where It Matters

FLORIDA BEACH ROUTES:

Panama City (ECP):

  • Doubled frequency: 4 daily flights → 8 daily flights
  • Capacity: 1,200 daily seats (peak spring break)
  • Timing: March 2-15 = peak college spring break
  • Passenger profile: 18-25 year olds, budget-conscious, party-focused

Sarasota (SRQ):

  • Doubled frequency: 3 daily → 6 daily
  • Capacity: 900 daily seats
  • Passenger profile: 35-65 year olds, families, retirees, cultural tourists (vs party scene)

Fort Myers (RSW):

  • 30% increase: 10 daily → 13 daily
  • Capacity: 2,000+ daily seats
  • Passenger profile: Mixed—families (Fort Myers Beach), retirees (Naples, Sanibel Island)

LAS VEGAS (LAS):

  • Doubled frequency: 8 daily → 16 daily
  • Capacity: 2,400 daily seats (peak spring break)
  • Passenger profile: 21-55 year olds, bachelor/bachelorette parties, conventions, entertainment

Las Vegas Spring Break Stats:

  • 42 million annual visitors (pre-pandemic 40M, now recovered + grown)
  • March = #2 busiest month (after December holidays)
  • Hotel occupancy: 95%+ March weekends
  • Average daily rate (ADR): $220/night March (vs $140 Jan/Feb)

Convention Calendar March 2026:

  • SXSW overflow (Austin event drives Vegas secondary travel)
  • NCAA March Madness (sports betting surge)
  • Trade shows (construction, manufacturing, logistics)

American capturing: Leisure + business dual demand with doubled frequency.


Business Travel: Tech/Finance Corridors Strengthened

SAN FRANCISCO (SFO):

More than doubled frequency: 5 daily → 12 daily

Why SFO Matters:

  • Tech corridor: Chicago-Bay Area critical for tech companies with dual-coast presence
  • Examples:
    • Google: Chicago engineering office (2,000 employees) + Mountain View HQ (25,000)
    • Salesforce: Chicago Tower (1,000+) + San Francisco HQ (9,000)
    • Oracle: Chicago office (500+) + Bay Area campuses (10,000)

Weekly tech shuttles:

Engineers/executives fly weekly Chicago ↔ San Francisco—5 daily flights inadequate, 12 daily enables morning/midday/evening options.

Competitive context:

United DOMINATES San Francisco (it’s United’s second-largest hub after Newark)—American increasing ORD-SFO = direct challenge to United’s stronghold.


BOSTON (BOS):

Increased frequency: 10 daily → 14 daily

Why Boston:

  • Financial services: Chicago (derivatives, options trading) + Boston (asset management, mutual funds)
  • Higher education: Northwestern, University of Chicago + Harvard, MIT partnerships (faculty travel, student recruitment)
  • Healthcare: Both cities biotech/pharma hubs (Abbott Chicago, Biogen Boston)

Business traveler preference:

Morning flights = arrive Boston 9-10 AM for full workday, return same evening or next day—14 daily flights enables more same-day roundtrips.


ORLANDO (MCO):

Increased frequency: 12 daily → 16 daily

Dual demand:

  • Leisure: Disney, Universal Studios family vacations
  • Business: Convention Center (Orange County Convention Center = 2nd largest US, 2M annual attendees)

Convention calendar Orlando March 2026:

  • Technology conferences (AWS, Microsoft partner events)
  • Medical device trade shows
  • Hospitality industry conventions

American strategy: Capture both leisure families AND business conventioneers with increased frequencies.


Financial Analysis: Why This Expansion Makes Sense

AMERICAN’S FINANCIAL POSITION:

2025 Financial Performance:

  • Revenue: $52 billion (projected)
  • Operating margin: 8-10% (improving from pandemic lows)
  • Debt: $38 billion (down from $42B 2024—paying down pandemic debt)
  • Fleet modernization: Delivering new 787-9s, A321neos (fuel-efficient aircraft enabling profitable thin routes)

Can American afford this expansion?

YES—because:

  1. New aircraft economics: 787-9 burns 20% less fuel than older 767s—enables profitable long-haul routes previously unviable
  2. Premium cabin revenue: First class on every flight generating 3-5× economy yield
  3. Hub consolidation: Concentrating growth at DFW, CLT, ORD (vs spreading thin across 10 hubs) = economies of scale
  4. Competitive necessity: Losing Chicago = losing Midwest dominance = strategic disaster

REVENUE PROJECTIONS:

100 daily flights × 365 days = 36,500 additional annual flights

Average aircraft size: 150 seats (mix of regional jets, narrowbody, widebody)

Load factor: 85% (industry average)

36,500 flights × 150 seats × 85% = 4.65 million additional passengers annually

Average fare: $250 (domestic), $800 (international Paris/Dublin)—blended $300

4.65M passengers × $300 = $1.4 billion incremental revenue annually

Operating margin: 10%

$1.4B revenue × 10% = $140 million annual profit (after costs: fuel, crew, aircraft, maintenance)

Payback period: 3-5 years (assuming $500M upfront investment gates, aircraft, marketing)


COMPETITIVE IMPERATIVE:

Losing Chicago = losing Midwest:

  • Chicago = gateway to 20-state Midwest region (60 million population)
  • If United monopolizes ORD, American loses midwest passengers who connect through United hubs
  • Strategic necessity: Defend Chicago AT ALL COSTS—even if expansion marginally profitable short-term, long-term market share protection worth billions

Passenger Experience: What Travelers Can Expect

MORE FLIGHT OPTIONS:

Before (Spring 2025):

Chicago-Las Vegas: 8 daily flights (roughly every 90 minutes)

After (Spring 2026):

Chicago-Las Vegas: 16 daily flights (roughly every 45 minutes)

Benefit: Miss your morning flight? Next one in 45 minutes (vs waiting 90 minutes). Late meeting? Catch evening flight without stressing about last departure.


BETTER CONNECTION TIMES:

Hub-and-spoke model:

Most passengers connect through Chicago (vs direct origin-destination).

Example:

  • Passenger: Grand Rapids → Chicago → Las Vegas
  • Before: Limited Vegas flight times = long connection waits (2-4 hours between flights)
  • After: More Vegas departures = shorter connections (60-90 minutes)

Time savings: 1-3 hours per trip.


PREMIUM CABIN ACCESS:

Every flight has first class:

  • Even short regional routes (Chicago-Indianapolis 45min flight) = first class available
  • Business travelers book last-minute = pay premium for guaranteed first class seat
  • Leisure travelers upgrade with miles/points

Amenities:

  • Wider seats (20-21″ width vs 17-18″ economy)
  • More legroom (38-40″ pitch vs 30-31″ economy)
  • Priority boarding, overhead bin space
  • Complimentary snacks/drinks (vs buy-onboard economy)

OPERATIONAL RELIABILITY:

Connection-saving AI technology means:

  • Fewer missed connections (system holds flights for delayed passengers when viable)
  • Less rebooking stress
  • Higher on-time arrival rate

Most on-time legacy carrier ORD 2025:

  • 82% on-time arrivals = 4 out of 5 flights arrive within 15 minutes of schedule
  • Industry average: 75-78%
  • American beats United at United’s own hub—remarkable achievement

Risks & Challenges

AIRPORT CONGESTION:

ORD operating near capacity:

  • Runway capacity: 6 runways, but weather/wind reduces to 3-4 effective runways
  • Gate capacity: 191 gates total, American + United + Delta + Southwest + others competing for space
  • Taxiway bottlenecks: Aircraft wait 20-40 minutes for takeoff during peak hours

Adding 100 AA flights + United’s 650 flights = 750+ combined daily departures:

Risk: Airport can’t handle volume—delays cascade, passengers suffer.

Solution?

Chicago Department of Aviation exploring:

  • Additional runways (multi-billion dollar, decade-long projects)
  • Gate expansion (add 20-30 gates Terminal 3)
  • Taxiway redesign (reduce bottlenecks)

BUT: All expensive, long-term—short-term, congestion likely worsens 2026-2027.


CREW SHORTAGES:

Pilot/flight attendant availability:

  • Pilot shortage: Industry-wide issue—regional airlines especially struggling
  • American hiring: 2,000+ pilots annually (but retirements + growth = still tight)
  • Flight attendants: Easier to hire but training takes 6 weeks

100 additional daily flights require:

  • 200-300 additional pilots (2 pilots per flight × 100 flights)
  • 400-600 additional flight attendants (4-6 per flight × 100 flights)

American’s plan:

  • Accelerated hiring 2025-2026
  • Retention bonuses (pay pilots/FAs more to stay vs jump to competitors)
  • Training capacity expansion (more simulators, instructors)

Risk: Can’t hire fast enough = cancel flights, disappoint passengers.


FINANCIAL PRESSURES:

American’s debt load:

  • $38 billion debt (down from $42B but still high vs competitors)
  • Interest payments: ~$2 billion annually
  • Credit rating: Below investment grade (junk status)

Expansion requires:

  • Gate purchases ($30M Spirit gates)
  • Aircraft acquisitions/leases
  • Marketing campaigns
  • Infrastructure investments

If expansion doesn’t generate expected revenue:

  • Debt servicing difficult
  • Investor confidence shaken
  • Credit rating downgraded further

UNITED COUNTERMOVE:

United won’t sit idly by:

American adding 100 flights = United likely responds with own expansion or competitive pricing.

Possible United responses:

  • Add more frequencies on AA’s new routes (match capacity)
  • Undercut pricing (fare war)
  • Launch new routes AA doesn’t serve (differentiation)
  • Invest in premium product (make United more attractive than AA)

Result: Escalating turf war—good for passengers (competition = lower fares), risky for airlines (margins compressed).


Bottom Line: American All-In on Chicago Comeback

American Airlines’ March 2026 Chicago O’Hare expansion—100 new daily flights pushing total to 500 peak departures (30% surge)—represents definitive rejection of analyst speculation carrier might deprioritize Chicago for Dallas/Charlotte sunbelt hubs, instead launching most aggressive legacy hub growth in modern aviation history as company battles United for Midwest dominance where Chicago-based rival traditionally commanded 60%+ market share.

Strategic gate acquisition from bankrupt Spirit Airlines ($30M, December 2025) following United’s legal victory securing additional ORD gates demonstrates American’s willingness to invest capital defending third-largest global hub (after DFW, CLT), reversing 2020-2024 period where AA operated just 76% of pre-pandemic Chicago capacity vs United’s 99% recovery, allowing United to consolidate market advantage (3.8M monthly seats vs AA’s 2.7M) and launch 13 new routes 2025 while American stagnated.

Spring break travelers benefit immediately from doubled capacity Las Vegas/Panama City/Sarasota, more-than-doubled San Francisco/Savannah service, plus extended Paris shoulder season (March-October vs June-September) and Dublin extension (May-September vs June-August), providing Chicago-based passengers unprecedented flight options for leisure (beach, entertainment, cultural) and business (tech, finance, conventions) travel at time when competition between AA and United should pressure fares downward 15-30% on overlapping routes.

Operational excellence positioning—most on-time legacy carrier ORD 2025 (82% arrival punctuality), connection-saving AI technology holding flights for delayed passengers, premium cabin on every flight (ONLY ORD airline achieving this), mobile app redesign, baggage handling improvements (33% fewer mishandled bags)—demonstrates American’s $500M+ Chicago infrastructure investment extends beyond flight count to customer experience enhancements United historically dominated given Chicago headquarters advantage.

But risks loom: ORD airport congestion (750+ combined AA/United daily departures approaching runway/gate capacity limits), crew shortages (200-300 additional pilots, 400-600 flight attendants required for 100-flight expansion), American’s $38B debt load (interest payments $2B annually constraining expansion capital), and inevitable United countermove (pricing war, capacity match, or premium product differentiation) all threaten expansion profitability, raising question whether ambitious growth sustainable long-term or short-term market-share grab risking operational meltdown reminiscent of 2022-2023 summer travel chaos when airlines added capacity faster than infrastructure/staffing could support.

For Chicago travelers March 2026 forward: More flights, more destinations, more frequencies = better convenience, potentially lower fares (competition effect), but expect higher delays (congestion), longer tarmac waits (gate availability), and possibility expansion contracts if financial/operational pressures prove unsustainable—book spring break trips NOW before routes fill, consider early-morning departures (fewer delays than afternoon/evening), and prepare backup plans (connections might get tight when airport operating 500+ AA daily + 650+ United daily simultaneously).

American’s Chicago bet: Bold, necessary, risky. If successful, cements AA as Midwest powerhouse for next decade. If fails, becomes cautionary tale of overreach—time will tell whether 500 daily flights is strategy or hubris.


Additional Resources

BOOKING LINKS:


CHICAGO O’HARE AIRPORT:


AMERICAN AIRLINES CUSTOMER SERVICE:

  • Phone: 1-800-433-7300
  • AAdvantage: https://www.aa.com/aadvantage (frequent flyer program)
  • App: Download iOS/Android (mobile check-in, boarding pass, flight status)

Related Travel Tourister Coverage:


Published: January 6, 2026 Last Updated: January 6, 2026 at 12:00 PM ET Reading Time: 50 minutes

Posted By : Vinay

As a lead contributor for Travel Tourister, Vinay is dedicated to serving our Tier 1 audience (US, UK, Canada, Australia). His mission is to deliver precise, fact-checked news and actionable, data-driven articles that empower readers to make informed decisions, minimize travel risks, and maximize their adventure without compromising safety or budget.

Lastest News

How to reach

2nd Floor, 39, Above Kirti Club, DLF Industrial Area, Kirti Nagar, New Delhi, Delhi 110015

Payment Methods

card

Connect With Us

Travel Tourister is a leading Travel portal where we introduce travellers to trusted travel agents to make their journey hasselfree, memorable And happy. Travel Tourister is a platform where travellers get Tour packages ,Hotel packages deals through trusted travel companies And hoteliers who are working with us across the world. We always try to find new and more travel agents and hoteliers from every nook and corners across the world so that you could compare the deals with different travel agents and hoteliers and book your tour or hotel with the one you have chosen according to your taste and budget.

Your Tour Package Requirement

Copyright © Travel Tourister, India. All Rights Reserved

Travel Tourister Rated 4.6 / 5 based on 22924 reviews.