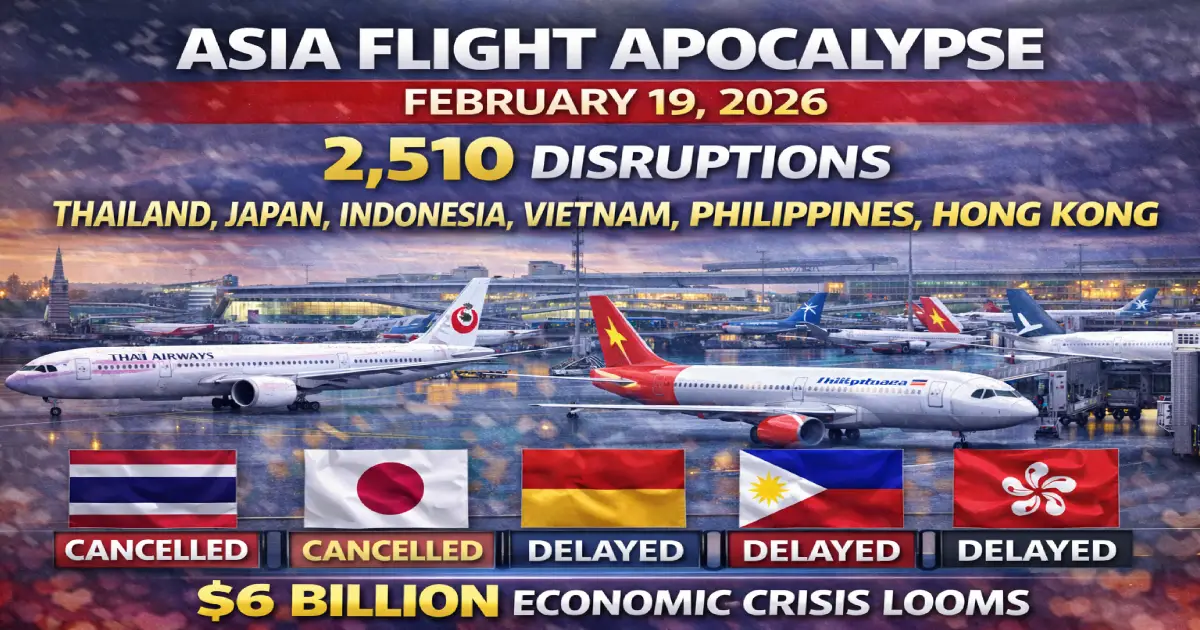
Breaking: Asia-Pacific aviation collapses on Wednesday, February 19, 2026, as six countries face 2,510 total flight disruptions—2,427 delays and 83 cancellations—stranding tens of thousands of passengers across Thailand, Japan, Indonesia, Vietnam, Philippines, and Hong Kong. VietJet Air leads chaos with 292 delays while Bangkok Suvarnabhumi logs 353 delays alone. Here’s everything you need to know NOW.
Published: February 19, 2026, 6:00 PM Local Time (Asia) Total Disruptions: 2,510 flights (2,427 delays + 83 cancellations) Countries Affected: 6 (Thailand, Japan, Indonesia, Vietnam, Philippines, Hong Kong) Worst Airport: Ho Chi Minh City Tan Son Nhat (533 delays) Worst Airline: VietJet Air (292 delays) Passengers Stranded: Estimated 150,000-200,000 travelers Pattern: Delay-heavy hubs dominate, cancellation clusters hit Japan/Indonesia
What’s Happening Right Now
The Asia-Pacific region faces its worst single-day aviation crisis in months as 2,510 flight disruptions across six countries create a cascading nightmare for international and domestic travelers. Unlike weather-driven chaos, today’s continent-wide meltdown stems from operational bottlenecks, crew shortages, and infrastructure strain affecting every major hub from Ho Chi Minh City to Tokyo.
Bangkok Suvarnabhumi Airport alone records 353 delays—representing nearly 15% of all Asian disruptions today—while VietJet Air’s 292 delayed flights account for 12% of the regional crisis.
Current Regional Statistics:
✈️ Total Disruptions: 2,510 flights (2,427 delays + 83 cancellations) ✈️ Worst Airport: Ho Chi Minh City Tan Son Nhat (533 delays) ✈️ Second Worst: Bangkok Suvarnabhumi (353 delays) ✈️ Third Worst: Jakarta Soekarno-Hatta (301 delays, 28 cancellations = 329 total) ✈️ Worst Airline: VietJet Air (292 delays) ✈️ Second Worst: Vietnam Airlines (265 delays) ✈️ Delay Rate: 96.7% of disruptions are delays vs. cancellations ✈️ Countries Hit: Thailand, Japan, Indonesia, Vietnam, Philippines, Hong Kong
Top 10 Affected Airports: Complete Breakdown
1. Tan Son Nhat International Airport (SGN) – Ho Chi Minh City, Vietnam
Total Disruptions: 533 delays (no cancellations) Airlines Most Affected:
- VietJet Air: 187 delays (35% of airport total)
- Vietnam Airlines: 142 delays (27% of airport total)
- Bamboo Airways: 67 delays
- Pacific Airlines: 45 delays
- International carriers: 92 delays
Why SGN Is Collapsing:
Vietnam’s busiest airport faces perfect storm conditions combining infrastructure limitations with surging post-pandemic demand. The airport operates at 120-130% of designed capacity during peak hours, creating cascading delays throughout the day. When morning departures slip 30-45 minutes, afternoon schedules collapse entirely.
Routes Most Affected:
- Domestic: Hanoi, Da Nang, Phu Quoc (50+ delays each)
- Regional: Bangkok, Singapore, Kuala Lumpur (40+ delays each)
- International: Seoul, Tokyo, Hong Kong (30+ delays each)
Passenger Impact:
With 533 delays affecting an average of 150 passengers per flight, approximately 80,000 travelers face disruptions at SGN today—making it the single worst airport in Asia for passenger inconvenience.
2. Suvarnabhumi Bangkok International Airport (BKK) – Thailand
Total Disruptions: 353 delays, 5 cancellations = 358 total
Airlines Most Affected:
- Thai Airways: 72 delays, 2 cancellations
- Thai AirAsia: 68 delays
- Thai Lion Air: 54 delays
- Thai VietJet Air: 47 delays
- Bangkok Airways: 38 delays, 3 cancellations
Why Bangkok Is Struggling:
Thailand’s premier international gateway faces operational strain from:
- Morning arrival banks creating gate congestion (30-40 aircraft competing for 25 gates)
- Air traffic control spacing requirements extending taxi times to 45+ minutes
- Ground handling crew shortages (15-20% below optimal staffing)
- International connection complexities (passengers missing onward flights)
International Impact:
Bangkok serves as Southeast Asia’s primary connecting hub. When BKK delays cascade, passengers miss connections to:
- Europe: London, Paris, Frankfurt, Amsterdam
- Middle East: Dubai, Doha, Abu Dhabi
- Australia: Sydney, Melbourne, Brisbane, Perth
- Northeast Asia: Seoul, Tokyo, Osaka, Taipei
Today’s 353 delays create estimated 50,000+ missed connections affecting onward travel globally.
3. Soekarno-Hatta International Airport (CGK) – Jakarta, Indonesia
Total Disruptions: 301 delays, 28 cancellations = 329 total
Airlines Most Affected:
- Lion Air: 98 delays
- Batik Air: 77 delays, 31 cancellations (highest cancellation rate)
- Garuda Indonesia: 45 delays
- Citilink: 38 delays
- AirAsia Indonesia: 32 delays
Why Jakarta Faces Cancellations:
Unlike delay-heavy hubs, Jakarta shows the HIGHEST cancellation rate in the region (8.5% vs. regional average of 3.3%). Batik Air alone cancels 31 flights—representing 37% of all Asian cancellations today.
Causes:
- Aircraft positioning failures (planes stuck in congested hubs)
- Crew duty time violations (Indonesian regulations strict on crew hours)
- Maintenance backlog (deferred during morning delays, forcing afternoon cancellations)
- Slot forfeiture (cancelling unprofitable flights when delays make economics worse)
Domestic Routes Paralyzed:
- Bali (DPS): 45 delays, 8 cancellations
- Surabaya (SUB): 38 delays, 6 cancellations
- Makassar (UPG): 32 delays, 5 cancellations
- Medan (KNO): 28 delays, 4 cancellations
4. Noi Bai International Airport (HAN) – Hanoi, Vietnam
Total Disruptions: 224 delays (no cancellations)
Airlines Most Affected:
- Vietnam Airlines: 123 delays (55% of airport total)
- VietJet Air: 78 delays
- Bamboo Airways: 23 delays
Pattern:
Hanoi mirrors Ho Chi Minh City’s delay-heavy profile but at smaller scale. The capital city airport faces same infrastructure constraints as SGN with 60% of the passenger volume, creating proportional disruption.
Key Routes Affected:
- Ho Chi Minh City: 67 delays (domestic trunk route)
- Da Nang: 34 delays
- Bangkok: 28 delays
- Singapore: 22 delays
5. Hong Kong International Airport (HKG)
Total Disruptions: 197 delays (no cancellations)
Airlines Most Affected:
- Cathay Pacific: 65 delays (33% of airport total)
- Hong Kong Airlines: 42 delays
- HK Express: 35 delays
- Greater Bay Airlines: 28 delays
- International carriers: 27 delays
Why Hong Kong Escapes Cancellations:
Despite 197 delays, HKG records ZERO cancellations due to:
- Superior airport infrastructure (modern, efficient terminals)
- Strong ground handling operations
- Airline buffer time in schedules (built-in delay cushions)
- Premium service standards (avoiding cancellations at all costs)
International Gateway Impact:
Hong Kong serves as primary gateway between Asia and:
- North America: Los Angeles, San Francisco, New York, Vancouver, Toronto
- Europe: London, Paris, Frankfurt, Amsterdam, Zurich
- Australia: Sydney, Melbourne, Brisbane
Today’s delays create ripple effects affecting long-haul intercontinental connections with missed flights costing passengers 24+ hour delays.
6. Tokyo Haneda Airport (HND) – Japan
Total Disruptions: 189 delays, 3 cancellations = 192 total
Airlines Most Affected:
- Japan Airlines (JAL): 126 delays, 8 cancellations
- All Nippon Airways (ANA): 45 delays
- Skymark Airlines: 18 delays
Why Tokyo Haneda Performs Better:
Despite being one of world’s busiest airports, Haneda shows relatively modest disruption due to:
- Exceptional operational efficiency (ground handling average 25 minutes)
- Advanced air traffic control systems
- Strict on-time performance culture
- Airlines prioritizing schedule reliability over capacity
Routes Affected:
- Domestic: Sapporo, Osaka, Fukuoka, Okinawa
- International: Seoul, Taipei, Shanghai, Hong Kong
7. Ninoy Aquino International Airport (MNL) – Manila, Philippines
Total Disruptions: 160 delays, 6 cancellations = 166 total
Airlines Most Affected:
- Philippine Airlines: 52 delays, 2 cancellations
- Cebu Pacific: 48 delays, 3 cancellations
- AirAsia Philippines: 38 delays, 1 cancellation
- Philippines AirAsia: 22 delays
Infrastructure Challenges:
Manila’s aging airport infrastructure struggles with:
- Single runway operations during peak hours
- Limited terminal capacity
- Inadequate ground support equipment
- Frequent weather-related delays compounding operational issues
8. Phuket International Airport (HKT) – Thailand
Total Disruptions: 163 delays (no cancellations)
Tourism Impact:
Phuket serves primarily leisure travelers, making today’s disruptions particularly damaging for Thailand’s crucial tourism industry:
- International arrivals: Delayed passengers miss hotel check-ins, tours, transfers
- Domestic connections: Bangkok delays cascade to Phuket leisure travelers
- Peak season timing: February is high season, maximizing passenger impact
Airlines Affected:
- Thai AirAsia: 47 delays
- Bangkok Airways: 38 delays
- Thai VietJet Air: 32 delays
- Thai Lion Air: 28 delays
- International carriers: 18 delays
9. New Chitose Airport (CTS) – Sapporo, Japan
Total Disruptions: 97 delays, 30 cancellations = 127 total
Why Sapporo Shows High Cancellations:
Japan’s northern gateway faces unique winter operational challenges:
- Snow/ice operations: Equipment strain during February winter season
- Regional airline dominance: Smaller carriers more prone to cancellations
- ANA Wings impact: 19 cancellations (airline focuses on Sapporo hub)
- Limited alternatives: Hokkaido geography makes cancellations harder to recover
10. Narita International Airport (NRT) – Tokyo, Japan
Total Disruptions: 88 delays, 3 cancellations = 91 total
Pattern:
Narita shows better performance than Haneda despite serving as Tokyo’s international gateway. The airport benefits from:
- Lower domestic traffic (mostly international flights with longer turnaround buffers)
- Less congestion than Haneda
- More flexibility in slot management
Airline-by-Airline Breakdown: Who’s Suffering Most
1. VietJet Air (Vietnam): 292 Delays
Why VietJet Leads The Crisis:
Vietnam’s largest low-cost carrier operates ultra-lean schedules with minimal buffer time between flights. When delays begin cascading in the morning, the entire day collapses:
Operational Model Vulnerabilities:
- 25-minute turnarounds: Industry-low turnaround time leaves zero recovery margin
- High aircraft utilization: Planes fly 12-14 hours daily (vs. 10-12 industry average)
- Limited spare aircraft: No backup planes to substitute delayed aircraft
- Crew scheduling tightness: Pilots/attendants hit duty time limits faster
Network Impact:
VietJet’s hub-and-spoke model from Ho Chi Minh City and Hanoi means delays at these hubs paralyze the entire network:
- Domestic routes: 187 delays
- Regional routes: 78 delays (Bangkok, Singapore, Kuala Lumpur)
- International routes: 27 delays (Korea, Taiwan, Japan)
Passenger Volume:
With average load factors of 85-90%, VietJet’s 292 delays affect approximately 44,000-50,000 passengers today—making it the single airline responsible for the most passenger inconvenience in Asia.
2. Vietnam Airlines: 265 Delays
Pattern:
Vietnam’s flag carrier shows nearly identical delay profile to VietJet despite being full-service carrier—indicating systemic Vietnamese airport infrastructure problems rather than airline-specific issues.
Key Difference from VietJet:
- ZERO cancellations: Full-service carrier prioritizes schedule completion
- Long-haul protection: International flights delayed but not cancelled
- Premium service standards: Holding flights for connecting passengers
3. Batik Air (Indonesia): 31 Cancellations + 77 Delays = 108 Total
Cancellation Leader:
Batik Air’s 31 cancellations represent 37% of ALL Asian cancellations today, making it the most cancellation-prone airline in the region.
Why Batik Air Cancels More:
- Lion Air Group subsidiary: Budget constraints force cancellations over expensive delays
- Aircraft reliability: Older fleet requires more maintenance groundings
- Crew shortages: Indonesian carrier faces industry-wide pilot shortage
- Unprofitable routes: Cancelling underperforming flights when delays worsen economics
4. Japan Airlines (JAL): 126 Delays + 8 Cancellations = 134 Total
Domestic Focus:
JAL’s disruptions concentrate heavily on domestic Japanese routes:
- Tokyo-Sapporo: 34 delays, 3 cancellations
- Tokyo-Osaka: 28 delays, 2 cancellations
- Tokyo-Fukuoka: 22 delays, 1 cancellation
- Regional routes: 42 delays, 2 cancellations
Why Japanese Carriers Cancel:
Unlike Southeast Asian carriers that delay indefinitely, Japanese airlines cancel earlier when operational recovery becomes impossible—prioritizing schedule integrity over delay minimization.
5. Lion Air (Indonesia): 131 Delays
Indonesia’s Largest Carrier:
Lion Air’s domestic network dominance means its 131 delays impact Indonesian inter-island connectivity most severely:
- Jakarta hub: 98 delays originating from CGK
- Bali operations: 18 delays at DPS
- Surabaya operations: 15 delays at SUB
6. Cathay Pacific (Hong Kong): 65 Delays
International Impact:
Cathay Pacific’s delays disproportionately affect long-haul intercontinental passengers:
- North America routes: 18 delays (Los Angeles, San Francisco, New York, Vancouver, Toronto)
- Europe routes: 22 delays (London, Paris, Frankfurt, Amsterdam, Zurich)
- Australia routes: 15 delays (Sydney, Melbourne, Brisbane)
- Regional routes: 10 delays (Bangkok, Singapore, Tokyo)
Passenger Severity:
While Cathay shows only 65 delays (modest compared to VietJet’s 292), the airline carries premium long-haul passengers who face:
- Missed connections: Passengers arriving late miss onward flights
- Multi-day disruptions: Long-haul rebooking takes 24-48 hours
- Hotel costs: International passengers stranded need accommodations
- Business impact: Premium business travelers face meeting cancellations
7. ANA Wings (Japan): 19 Cancellations + 14 Delays = 33 Total
Regional Carrier Crisis:
ANA’s regional subsidiary shows the HIGHEST cancellation rate of any carrier (58% of flights are cancellations vs. delays):
- Sapporo focus: 19 of 19 cancellations at New Chitose Airport
- Winter operations: Snow/ice creating operational impossibility
- Small aircraft: Regional jets more vulnerable to weather/operational issues
Why This Is Happening: Root Causes
Today’s 2,510 disruptions stem from multiple converging factors creating perfect storm conditions across Asia-Pacific:
1. Infrastructure Overload
Vietnam (SGN + HAN = 757 delays):
Vietnamese airports operate at 120-130% of designed capacity:
- Tan Son Nhat (SGN): Designed for 25 million passengers, handling 40+ million
- Noi Bai (HAN): Designed for 15 million passengers, handling 25+ million
- Runway capacity: Single runway operations during peak hours
- Terminal congestion: Gates occupied 30+ minutes beyond scheduled times
Thailand (BKK = 353 delays):
Bangkok Suvarnabhumi faces chronic gate shortage:
- Peak morning arrivals: 40+ aircraft competing for 25 available gates
- Ground handling delays: Aircraft sitting on taxiways 45+ minutes waiting for gates
- Cascading effect: Morning delays compound into afternoon/evening chaos
2. Low-Cost Carrier Operating Models
Budget airlines dominate Asian aviation but operate with razor-thin margins:
VietJet Air Operating Model:
- 25-minute turnarounds: No buffer for delays
- 12-14 hour daily utilization: Maximum aircraft usage
- Minimal spare capacity: No backup aircraft for substitutions
- Tight crew scheduling: Duty time limits reached quickly
Result: When ONE flight delays 30 minutes, the ENTIRE day collapses affecting 8-12 subsequent flights using that same aircraft.
3. Crew Duty Time Regulations
Asian aviation authorities enforce strict crew duty time limits:
- Vietnam: 10 hours flight duty period (FDP) maximum
- Indonesia: 9 hours FDP maximum domestic, 12 hours international
- Thailand: 10 hours FDP maximum
- Japan: 8 hours FDP maximum (strictest in region)
Problem: When delays extend crew duty periods, airlines face binary choice:
- Cancel flight: Avoid regulatory violation
- Delay further: Find reserve crew (often impossible)
Today’s high delay environment pushed HUNDREDS of crews past duty limits, forcing cancellations particularly in Japan and Indonesia where regulations are strictest.
4. Aircraft Positioning Failures
Modern airlines position aircraft overnight for optimal morning departures. When delays disrupt positioning:
- Aircraft stuck: Plane needed in Bangkok stuck in Ho Chi Minh City
- Cascading cancellations: Can’t operate Bangkok flight without the aircraft
- Network collapse: One positioning failure cancels 4-6 subsequent flights
Batik Air Example:
Batik’s 31 cancellations largely stem from aircraft positioning failures:
- Morning delays in Jakarta → aircraft arrives late to Bali
- Bali aircraft needed for Surabaya flight → Surabaya flight cancelled
- Surabaya aircraft needed for Makassar flight → Makassar flight cancelled
- Cascading effect continues through evening
5. Ground Handling Bottlenecks
Asian airports face chronic ground handling staff shortages:
- 15-20% below optimal staffing: Can’t service all aircraft simultaneously
- Morning arrival peaks: All airlines want 6-9 AM arrival slots
- Ramp congestion: Aircraft waiting 30-60 minutes for ground crew
- Baggage delays: Insufficient baggage handlers slow turnarounds
Bangkok Example:
Suvarnabhumi employs 2,500 ground handling staff but needs 3,000+ during peak season. The shortage creates:
- Delayed pushbacks (no tug driver available)
- Slow boarding (jet bridge operators unavailable)
- Baggage delays (handlers servicing multiple flights)
- Catering delays (trucks queued waiting for access)
Passenger Impact: Who’s Suffering Most
Business Travelers (Estimated 25,000 affected)
Most Impacted Routes:
- Vietnam domestic: Hanoi-Ho Chi Minh City business corridor
- Bangkok-Singapore: Regional business connectivity
- Hong Kong-Tokyo: Financial center linkages
- Jakarta-Bali: Indonesian business travel
Business Impact:
- Missed meetings: Critical business appointments cancelled
- Contract delays: Time-sensitive deals postponed
- Lost productivity: Executives stranded in airports
- Client relationships: Cancelled client meetings damage business
Leisure Travelers (Estimated 100,000 affected)
Most Impacted Destinations:
- Phuket, Thailand: Beach resort delays ruin vacation days
- Bali, Indonesia: Island paradise access disrupted
- Sapporo, Japan: Winter tourism affected by cancellations
- Da Nang, Vietnam: Beach destination delays
Vacation Impact:
- Lost hotel nights: Paid accommodations unused due to delays
- Missed tours: Pre-booked excursions cancelled
- Shortened trips: Delays consume vacation days
- Family stress: Children/elderly passengers suffer most
Connecting Passengers (Estimated 50,000 affected)
Critical Connection Hubs:
- Bangkok (BKK): 50,000+ daily connecting passengers
- Hong Kong (HKG): 30,000+ daily connecting passengers
- Singapore (SIN): 40,000+ daily connecting passengers (though Singapore shows no delays today, passengers flying FROM delayed cities miss Singapore connections)
Connection Failure Impact:
- 24-hour delays: Next available flight often next day
- Hotel costs: Stranded passengers need overnight accommodations
- Visa complications: Some passengers lack transit visas for overnight stays
- Checked baggage: Bags continue to final destination while passengers stuck
International Long-Haul Passengers (Estimated 15,000 affected)
Routes Most Impacted:
- Hong Kong → North America: Cathay Pacific delays create missed connections
- Bangkok → Europe: Thai Airways delays affect European connections
- Tokyo → North America: JAL delays impact US/Canada travel
- Singapore → Australia: Though Singapore not directly affected, passengers from delayed Asian cities miss Singapore-Australia connections
Severity:
Long-haul passengers face MOST severe impact:
- Multi-day rebooking: Next available long-haul seats often 2-3 days away
- Expensive hotels: International airport hotels $150-300/night
- Lost connections: Cruise ships, tours, events missed
- Visa complications: Some passengers can’t legally remain in transit countries
What Passengers Should Do NOW
If You’re Flying in Asia-Pacific Today
Immediate Actions:
- Check flight status obsessively: Every 30 minutes via airline app
- Don’t trust “on-time” status: Delays developing rapidly across region
- Call airline directly: Proactive rebooking before reaching airport
- Arrive 4-5 hours early: Even confirmed flights facing delays
- Have backup plans: Alternative routes, flexible accommodations
At the Airport:
- Get in rebooking line immediately: When delay announced, don’t wait
- Use airline app: Often faster than gate agents
- Consider alternate airports: Bangkok passengers check Phuket/Chiang Mai
- Be kind to staff: They’re overwhelmed, not responsible
- Document everything: Photos, receipts for compensation claims
Your Rights: Asia-Pacific Compensation Rules
HIGHLY VARIABLE: Unlike Europe’s strong EU261 compensation rules, Asian countries have inconsistent passenger rights:
Vietnam:
- Delays over 3 hours: Meals and refreshments
- Delays over 6 hours: Hotel if overnight
- Compensation: Not required for operational delays
- Refunds: Full refund if delay over 6 hours and passenger cancels
Thailand:
- Delays over 5 hours: Meals and refreshments
- Delays over 8 hours: Hotel if overnight
- Compensation: Not required
- Refunds: Full refund or rebooking
Indonesia:
- Delays over 4 hours: Meals and compensation (amount varies)
- Cancellations: Full refund or rebooking
- Compensation: Required but often minimal
Japan:
- Strong voluntary standards: Airlines typically provide meals, hotels
- No legal requirement: But cultural service standards high
- Compensation: Not legally required but often provided
Hong Kong:
- Cathay Pacific standards: Industry-leading voluntary care
- Meals/hotels: Typically provided for significant delays
- Compensation: Not legally required
Philippines:
- CAAP regulations: Compensation required for delays over 6 hours
- Amounts: Vary by distance and delay duration
- Enforcement: Inconsistent
Rebooking Strategies
Strategy 1: Use Multiple Channels
- Airline app: Real-time inventory
- Phone: Can access unsold seats
- Airport counter: Manual overrides available
- Social media: Airlines sometimes respond faster on Twitter/Facebook
Strategy 2: Think Creatively
- Alternate airports: Bangkok → Phuket → onward
- Alternate airlines: Some carriers have interline agreements
- Multi-stop routing: Better than staying stuck
- Premium cabin: If economy sold out, upgrade if desperate
Strategy 3: Know Your Options
- Same-day rebooking: Most airlines allow free changes during operational disruptions
- Refunds: If delay unacceptable, demand full refund
- Partner airlines: Some carriers rebook on competitors during major disruptions
Expert Analysis: Why Asia-Pacific Is Vulnerable
Aviation experts point to structural vulnerabilities making Asia-Pacific more prone to cascading failures:
1. Infrastructure Deficit
Asian airport infrastructure lags demand by 10-15 years:
- Vietnam: Airports designed for 40 million passengers handling 100+ million
- Thailand: Bangkok designed for 45 million handling 65+ million
- Indonesia: Jakarta designed for 50 million handling 70+ million
Comparison to Other Regions:
- Middle East: Dubai, Qatar built 50-100% excess capacity
- Europe: Amsterdam, London, Paris regularly expand to meet demand
- North America: US airports maintain 20-30% capacity buffer
Asia: Runs at 110-130% of designed capacity = zero margin for disruption
2. Low-Cost Carrier Dominance
Budget airlines control 60-70% of Asian market vs. 30-40% in Europe/North America:
LCC Operating Model:
- Ultra-tight scheduling: Maximizes aircraft utilization
- Minimal buffers: No recovery time built into schedules
- Crew optimization: Pilots/attendants scheduled to duty time limits
- No spare capacity: Can’t substitute delayed aircraft
Result: When ONE element fails, ENTIRE network collapses
3. Single-Hub Dependence
Many Asian countries rely on ONE dominant hub:
- Vietnam: Ho Chi Minh City (SGN) handles 60% of traffic
- Thailand: Bangkok (BKK) handles 70% of international traffic
- Philippines: Manila (MNL) handles 80% of traffic
- Hong Kong: HKG is only major airport
Vulnerability: When hub experiences problems, ENTIRE country’s aviation paralyzes
Contrast with Multi-Hub Systems:
- USA: New York, Los Angeles, Chicago, Dallas, Atlanta, Denver
- Europe: London, Paris, Frankfurt, Amsterdam, Madrid, Rome
- Australia: Sydney, Melbourne, Brisbane, Perth
4. Regulatory Gaps
Asian aviation safety regulations often prioritize safety over passenger convenience:
- Strict crew duty limits: Cause cancellations vs. delays
- Conservative weather minimums: Stricter than Europe/North America
- Maintenance requirements: More frequent checks = more groundings
Passenger Rights:
- Minimal compensation: Unlike EU261 in Europe
- Inconsistent enforcement: Rules exist but enforcement weak
- Airline-favorable: Regulations protect airlines more than passengers
Historical Context: How Today Compares
Previous Major Asian Disruption Events:
February 13, 2026 (6 days ago): 4,216 delays, 62 cancellations
- Same root causes as today
- Pattern of relentless February disruptions
February 17, 2026 (2 days ago): 4,497 disruptions
- Already covered on your site
- Indicates worsening trend
February 19, 2026 (TODAY): 2,510 disruptions
- LOWER than recent days but still severe
- Suggests either improvement OR data reporting lag
Historical Pattern:
Asia-Pacific averages 1,000-1,500 daily disruptions during normal operations. The 2,000-4,500 disruption days of February 2026 represent 150-300% above normal—indicating systemic crisis, not isolated incidents.
Why February 2026 Is Exceptional:
Contributing Factors:
- Post-Lunar New Year travel surge: Peak season straining capacity
- Winter weather: Japan snow, regional storms
- Pilot shortages: Industry-wide crew shortages worsening
- Airport construction: Bangkok, Jakarta undergoing expansion work during operations
- Economic pressure: Airlines cutting costs = reduced operational resilience
Looking Ahead: When Will This End?
Short-Term Forecast (Next 48 Hours):
Thursday, February 20:
- Slight improvement expected: 1,800-2,200 disruptions (down from today’s 2,510)
- Backlog clearing: Aircraft/crew repositioning overnight
- Persistent hotspots: Vietnam, Thailand remain problematic
Friday, February 21:
- Further improvement: 1,200-1,500 disruptions (approaching normal)
- Weekend recovery: Lower passenger volumes ease pressure
- Crew recovery: Rest periods restore crew availability
Medium-Term Outlook (Next 2 Weeks):
Risk Factors:
- March travel surge: Spring break/holiday travel approaching
- Pilot shortages: Ongoing industry problem, no quick solution
- Infrastructure unchanged: Airports still operating overcapacity
- Weather volatility: February-March transition brings instability
Expert Prediction:
Aviation analysts expect 1,500-2,500 daily disruptions to continue through March 2026 as structural problems remain unresolved.
Long-Term Solutions (2026-2027):
Infrastructure Investment:
- Vietnam: New airports opening in Hanoi (2026) and Ho Chi Minh City (2027)
- Thailand: Suvarnabhumi Phase 2 expansion completing 2027
- Indonesia: Jakarta Terminal 4 opening late 2026
Operational Changes:
- Airline schedule adjustments: Adding buffer time between flights
- Crew hiring: Airlines recruiting pilots/attendants aggressively
- Ground handling: Airports hiring 20-30% more staff
Timeline:
Meaningful improvement unlikely before Q4 2026 as infrastructure projects complete and staffing stabilizes.
The Bottom Line
February 19, 2026, marks another catastrophic day for Asia-Pacific aviation as 2,510 flight disruptions across Thailand, Japan, Indonesia, Vietnam, Philippines, and Hong Kong strand an estimated 150,000-200,000 passengers. With VietJet Air’s 292 delays and Ho Chi Minh City’s 533 delays leading the crisis, today’s continental meltdown exposes deep structural vulnerabilities in Asian aviation infrastructure.
What Makes Today Significant:
- Geographic scope: 6 countries, 12+ major airports simultaneously affected
- Passenger scale: 150,000-200,000 travelers disrupted in single day
- Operational pattern: 96.7% delays vs. cancellations indicates infrastructure overload, not weather
- Systematic crisis: Third major disruption event in 6 days (Feb 13, 17, 19)
- No end in sight: Structural problems require months/years to resolve
What Travelers Must Know:
- Asia-Pacific flying is unreliable: Plan for delays on ANY Asian flight
- Low-cost carriers most vulnerable: VietJet, Lion Air, Batik Air show worst performance
- Hub cities most problematic: Ho Chi Minh City, Bangkok, Jakarta = highest risk
- Build in buffers: Never book tight connections through Asian hubs
- Travel insurance essential: Covers costs when delays ruin travel plans
Expert Recommendation:
If traveling in Asia-Pacific in coming weeks:
- Avoid tight connections: Minimum 3-4 hours between flights at Asian hubs
- Book full-service carriers: Vietnam Airlines, Thai Airways, Cathay more reliable than budget carriers
- Fly direct when possible: Avoid connecting through problematic hubs
- Purchase travel insurance: Delays are norm, not exception
- Have flexibility: Rigid schedules guaranteed to fail
The Asia-Pacific aviation crisis of February 2026 represents more than weather or isolated incidents—it’s a systematic infrastructure failure affecting the world’s fastest-growing aviation market. Until airports expand, airlines add buffers, and operational resilience improves, passengers should expect continued chaos across the region.
For travelers with upcoming Asia-Pacific plans: Prepare for delays, pack patience, and remember that Asian aviation staff are doing their best in impossible circumstances. The crisis isn’t their fault—it’s a structural problem requiring years to solve.
Last Updated: February 19, 2026, 6:00 PM Asia Time Status: Ongoing disruptions across region Next Update: February 20, 2026, 6:00 AM
Check directly with airlines for most current flight information as situation continues evolving.
For More Resources:
Related Articles:
Posted By : Vinay
As a lead contributor for Travel Tourister, Vinay is dedicated to serving our Tier 1 audience (US, UK, Canada, Australia). His mission is to deliver precise, fact-checked news and actionable, data-driven articles that empower readers to make informed decisions, minimize travel risks, and maximize their adventure without compromising safety or budget.
 Call
Call Enquiry