Published on : 20 Feb 2026
INVISIBLE STORM PARALYSIS: The Northeast corridor descended into aviation chaos Thursday-Friday, February 19-20, 2026, as low clouds, reduced visibility, rain, and fog — weather conditions that don’t make headlines but strangle airport capacity — triggered Federal Aviation Administration Ground Delay Programs (GDPs) at six major airports with average delays reaching 86 minutes at Boston Logan, 106 minutes at LaGuardia (worst), 102 minutes at JFK, 80 minutes at Newark, 32 minutes at Philadelphia, and 26 minutes at Reagan National — affecting thousands of passengers as the “invisible storm” (no dramatic snow or thunderstorms, just persistent low ceilings and poor visibility) reduced arrival rates, forced runway configuration changes, stretched taxi times, and collapsed late afternoon and evening flight banks when aircraft rotations drifted, crews timed out, and gate occupancy surged — all while the partial US government shutdown (air traffic controllers unpaid since January 31) added operational strain, leaving business travelers missing critical Friday meetings, families stranded overnight, and ski resort visitors (Austin, ski country also flagged by FAA) unable to reach destinations as the Northeast’s critical role as America’s most congested airspace turned modest weather into nationwide cascading delays exposing structural fragility when federal government dysfunction meets weather-driven capacity constraints.
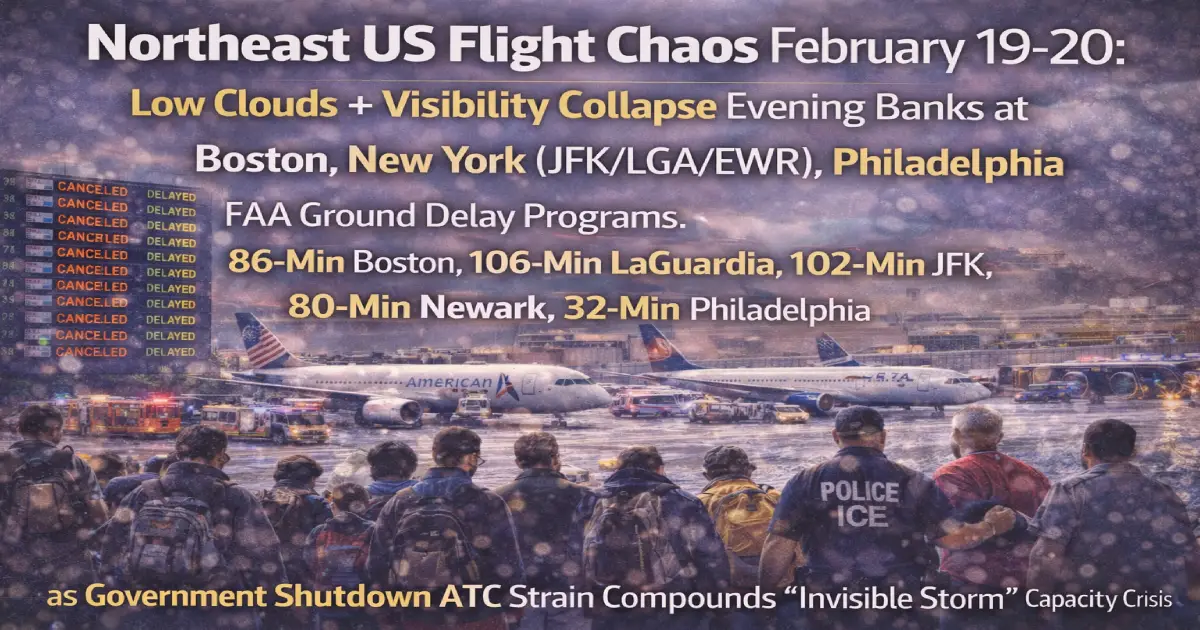
Published: February 19-20, 2026 (Thursday-Friday) Weather Type: Low clouds, reduced visibility, rain, fog (NOT dramatic storm) FAA Ground Delay Programs Active: 6 airports (BOS, JFK, LGA, EWR, PHL, DCA) Average Delays: Boston 86 min, LaGuardia 106 min (worst), JFK 102 min, Newark 80 min, Philadelphia 32 min, Reagan 26 min Affected Airports: BOS, JFK, LGA, EWR, PHL, DCA (Northeast corridor) + Austin (AUS), Detroit (DTW), Los Angeles (LAX), ski country Peak Impact Time: Late afternoon + evening banks (3:00 PM – 9:00 PM ET) Passengers Affected: Estimated 50,000-75,000 (Northeast corridor alone) Government Shutdown Context: ATC unpaid since January 31 (Day 20 of partial shutdown) Cascade Mechanism: Northeast drives first wave → West Coast compounds late-day recovery failure Root Cause: Arrival rate reductions (low ceilings = slower approach spacing)
Confirmed average delays (from Fox 29 Philadelphia):
GDP operational details:
DCA (Reagan National):
All six airports: Similar GDP structures limiting inbound flights, extending to many US and Canadian departure points.
Definition: A Ground Delay Program (GDP) is a traffic management measure used by the FAA when weather or other factors temporarily reduce an airport’s arrival capacity. Instead of letting flights take off and circle in holding patterns, the FAA assigns each flight a controlled departure time from its origin to better match the rate of safe landings at the destination.
How it works:
Why GDPs matter to passengers:
FAA Daily Outlook (February 19): Low clouds and visibility may delay flights in Boston (BOS), New York (JFK, LGA, EWR), Philadelphia (PHL) and Washington, D.C. (IAD, BWI, DCA). Low clouds could slow traffic in Detroit (DTW), Austin (AUS) and Los Angeles (LAX). Wind forecast in Chicago (ORD, MDW) and Salt Lake City (SLC).
What “low clouds and visibility” actually means:
Low ceilings:
Reduced visibility:
Why “invisible storm” is misleading:
Ground Delay Program: Advisory 019 (BOS/ZBW)
Why Boston struggled:
Routes affected:
Ground Delay Program: Advisory 040 (LGA/ZNY)
Why LaGuardia was worst: LaGuardia Airport (LGA / ZNY) is now under a GDP (Advisory 040) in response to low ceilings, rain, and visibility challenges. The FAA is restricting inbound flow, mandating that flights be delayed before departure rather than stacking in the air.
LaGuardia’s unique vulnerabilities:
106-minute delays = nearly 2 hours: Worst of all Northeast airports today.
Ground Delay Program: Advisory 045 (JFK/ZNY)
Why JFK struggled: The FAA has activated a Ground Delay Program (GDP) for John F. Kennedy International Airport (JFK / ZNY) under Advisory 045.
Travelers bound for JFK should stay in close contact with their airlines and anticipate possible gate holds or adjusted arrival times.
JFK’s challenges:
Ground Delay Program: Active (details limited in summaries)
Why Newark affected: While full details may be limited in some public summaries, the program generally includes departures from across the U.S. and parts of Canada and is designed to regulate arrival flow into Newark during degraded weather.
Newark’s role:
Ground Delay Program: Advisory 035 (PHL/ZNY)
Why Philadelphia performed better: Philadelphia International (PHL / ZNY) has also been placed in a Ground Delay Program (Advisory 035). With the nor’easter pushing moisture and low clouds into the region, PHL’s arrival capacity is being throttled to maintain air safety.
32-minute delays = relatively modest: Best Northeast performance (except Reagan’s 26 minutes).
Philadelphia’s advantage:
Ground Delay Program: Began 12:30 PM, expected through ~11:00 PM
Why Reagan performed best:
Critical insight from Adept Travel analysis: Philadelphia International Airport (PHL) is part of the same corridor pattern, so itineraries that rely on short Northeast connections, especially late afternoon and evening banks, are more likely to break.
That pattern matters because once the network loses slack, even modest delays tend to persist into evening departures.
What “evening bank collapse” means:
Morning flights (6:00 AM – 12:00 PM):
Late afternoon/evening flights (3:00 PM – 9:00 PM):
Why travelers should care: The FAA’s daily outlook specifically highlights low clouds and visibility for Boston, the New York terminal area airports, Philadelphia, Austin, and ski country, and it adds wind as a delay risk for San Francisco and Las Vegas. This combination is a classic setup where the Northeast drives the first wave of delay, and then the West Coast winds can limit late day recovery options if aircraft and crews arrive out of position. Travelers should plan around the idea that the worst disruption often shows up after midday, when banks are fuller and there is less open gate space to absorb late arrivals.
Partial US federal shutdown:
How shutdown compounds weather delays:
Reduced capacity:
FAA mandated cancellations (November 2025 precedent): The Federal Aviation Administration (FAA) mandated the cancellations as a safety measure at 40 major airports nationwide while air traffic controllers continue to work without pay, ratcheting up pressure on an already strained system.
Why this matters for low clouds event:
Austin (AUS): The FAA planning view also points to low ceilings and low visibility risk in Austin, which can become meaningful during peak arrival windows because spacing increases tend to ripple into longer taxi times.
Ski country airports: When mountain region airports and airspace get constrained, aircraft rotations drift, crews time out, and later legs across the country can lose their assigned equipment, which is where cancellations tend to emerge.
Travelers connecting through ski country should treat today as higher risk for downstream disruption even if their specific flights look fine early.
Ski airports affected:
West Coast winds: Watch for wind driven slowdowns at San Francisco and Las Vegas that can compound late day recovery.
Los Angeles (LAX): Low clouds could slow traffic in Los Angeles (LAX).
Critical advice from travel experts:
If connecting through Northeast (under 90 minutes): If your connection is under 90 minutes through the Northeast corridor today, or you are on separate tickets, your best move is usually to switch to an earlier departure or reroute before delay programs activate.
If on separate tickets: Avoid stacking separate ticket legs where one miss forces you to buy a new last minute ticket.
Pull up inbound aircraft tracking: If your itinerary touches Boston, JFK, LaGuardia, Newark, or Philadelphia, pull up your inbound aircraft and watch whether it is being held at its origin, because that is often the earliest sign that your flight will not recover later.
Clear decision thresholds: Use clear decision thresholds for rebooking versus waiting.
Monitor taxi and gate time: If you have a tight connection, assume taxi and gate time will run longer than usual under low ceilings.
Q: Why do low clouds cause delays when there’s no snow or storms? A: Low clouds reduce visibility and force slower, more precise approaches. This cuts arrival rates 30-50%. Fewer arrivals per hour = ground delays even without dramatic weather.
Q: Why was LaGuardia worst (106 min) when Reagan was only 26 min? A: LaGuardia has shortest runways, highest normal congestion, no capacity slack. Reagan has longer runways, less congestion, serves federal government (possible priority).
Q: Is the government shutdown making this worse? A: Yes. Air traffic controllers working without pay = higher stress, more sick calls, more conservative spacing. Weather + shutdown = compounding capacity loss.
Q: Should I avoid evening flights during low cloud conditions? A: Yes. Morning flights have buffer. Evening flights = aircraft out of position, crew timeouts, gate congestion. Book earliest departure possible.
Q: Can airlines compensate for weather delays? A: No. Weather = “extraordinary circumstances” under US DOT rules. Free rebooking or refund required, but no cash compensation.
The Northeast corridor’s February 19-20, 2026 “invisible storm” — low clouds, reduced visibility, rain, and fog that don’t make headlines but strangle capacity — triggered FAA Ground Delay Programs at six major airports with LaGuardia suffering worst at 106-minute average delays, JFK at 102 minutes, Boston at 86 minutes, Newark at 80 minutes as the weather-driven capacity collapse combined with Day 20 of the partial government shutdown (air traffic controllers unpaid since January 31) to crush late afternoon and evening flight banks when aircraft rotations drifted, crews timed out, gate occupancy surged, and the Northeast’s role as America’s most congested airspace amplified modest weather into nationwide cascading delays — proving that aviation’s worst disruptions often come not from dramatic blizzards but from persistent low ceilings and poor visibility that silently erode capacity while passengers ask “why are we delayed when it’s just cloudy?”
For Northeast travelers:
For More Information:
Related Articles:
Posted By : Vinay
This article is provided for general informational purposes only and is based on information available at the time of publication. Travel advisories, airline schedules, airport operations, visa requirements, government regulations, and other travel-related information are subject to change without prior notice. While Travel Tourister makes reasonable efforts to verify information using official announcements, government publications, airline and airport communications, and other reliable sources, we cannot guarantee that all information remains complete, accurate, or up to date at all times. Readers should independently verify any information that may affect their travel plans with the relevant airline, airport authority, government agency, embassy, or other official source before making travel, financial, or other decisions. Travel Tourister shall not be liable for any direct or indirect loss, inconvenience, or damages arising from the use of or reliance on the information contained in this article. Nothing in this publication constitutes legal, immigration, financial, or professional travel advice. If you believe any information in this article is inaccurate or outdated, please contact our editorial team. We review all credible correction requests promptly and update our content whenever appropriate.
Lastest News
2nd Floor, 39, Above Kirti Club, DLF Industrial Area, Kirti Nagar, New Delhi, Delhi 110015
Travel Tourister is a leading Travel portal where we introduce travellers to trusted travel agents to make their journey hasselfree, memorable And happy. Travel Tourister is a platform where travellers get Tour packages ,Hotel packages deals through trusted travel companies And hoteliers who are working with us across the world. We always try to find new and more travel agents and hoteliers from every nook and corners across the world so that you could compare the deals with different travel agents and hoteliers and book your tour or hotel with the one you have chosen according to your taste and budget.
Copyright © Travel Tourister, India. All Rights Reserved
 Call
Call Enquiry