Date: February 27, 2026 (Thursday — Recovery Day 5)
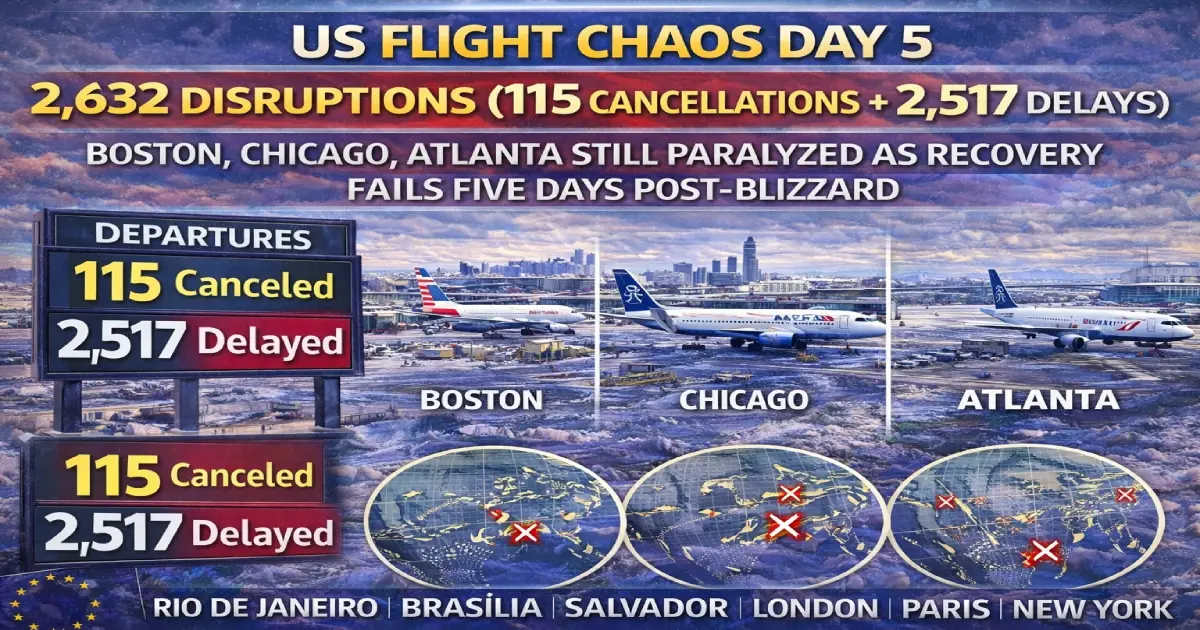
Total US Disruptions: 2,632 flights (115 cancellations + 2,517 delays)
Passengers Affected: 340,000-420,000 estimated
Primary Cause: Northeast blizzard recovery Day 5 + operational collapse
Hardest-Hit Airports: Chicago O’Hare (168 delays, delay capital), Atlanta (144 delays), Boston Logan (18 cancellations + 112 delays), Newark + JFK (207 combined delays), San Francisco (100 delays)
RECOVERY FAILURE DAY 5: America’s aviation system remains structurally paralyzed on Thursday, February 27, 2026 — five full days after Winter Storm Hernando’s historic Northeast blizzard — with 2,632 total flight disruptions (115 cancellations + 2,517 delays) stranding an estimated 340,000-420,000 passengers as Chicago O’Hare leads the nation with 168 delays (plus 6 cancellations) cementing its status as America’s “delay capital,” Atlanta Hartsfield-Jackson suffers 144 delays (plus 2 cancellations) proving the world’s busiest airport cannot absorb Northeast recovery strain, Boston Logan records 18 cancellations + 112 delays (130 total disruptions, highest cancellation count nationwide), Newark Liberty + JFK International log 207 combined delays despite single-digit cancellations as New York metro airports buckle under aircraft repositioning backlog, San Francisco battles 100 delays due to low cloud ceilings adding West Coast chaos to East Coast nightmare, while regional airports collapse entirely — Nantucket Memorial (14 cancellations), Martha’s Vineyard (11 cancellations), Barnstable Municipal (10 cancellations) — isolating New England island communities where United, Endeavor Air, Spirit Airlines, Air Canada, Alaska Airlines face the brutal mathematical reality that 2,517 delays = 18% of total US daily flights (approximately 14,000 daily domestic flights x 18% = widespread systemic failure), exposing how five days of perfect flying weather (Chicago 30°F/sunny, New York 35°F/clear, Atlanta 58°F/sunny, Boston 32°F/sunny) cannot overcome the cascading operational collapse triggered when 8,300+ Sunday-Monday flights cancelled, leaving aircraft parked in wrong cities, crews exhausted beyond FAA duty limits, connecting passengers stranded in rebooking hell, maintenance backlogs uncleared, de-icing fluid residue unremoved, and airport infrastructure maxed out with ZERO operational slack to absorb even minor disruptions. For Tier 1 travelers (US, UK, Canada, Australia), Day 5’s failure marks a critical inflection point: either airlines achieve full recovery by Saturday February 29 (unlikely given current trajectory), OR the Spring Break surge beginning March 14-22 (15 days away, 40+ million domestic travelers, 60% demand increase) collides with broken infrastructure creating catastrophic nationwide gridlock worse than 2022 holiday meltdowns, compounded by DHS partial shutdown (61,000 TSA agents unpaid since January 31, security checkpoints degrading), Air Canada Unifor strike (expires tomorrow February 28, 5,826 agents affecting US-Canada cross-border routes), and regional carrier structural collapse (Republic Airways, PSA, Endeavor proving unable to recover from weather events due to pilot shortages, thin margins, zero backup capacity).
📊 NATIONWIDE DISRUPTION BREAKDOWN (DAY 5 — FEB 27, 2026)
Overall US Statistics:
- Total Disruptions: 2,632 flights
- Cancellations: 115 (4.4% of disruptions)
- Delays: 2,517 (95.6% of disruptions)
- Passengers Affected: 340,000-420,000 (estimated 130-160 passengers/flight avg)
- Recovery Timeline: Day 5 post-Northeast blizzard (Feb 22-23)
- Weather Today: PERFECT across all major hubs (clear skies, light winds, no precipitation)
- Root Cause: Aircraft/crew positioning failures, maintenance backlogs, infrastructure overload
Critical Insight:
- 2,517 delays = 18% of daily US flights (approximately 14,000 domestic flights/day)
- 95.6% disruptions are DELAYS (not cancellations) = airlines avoiding cancellations but operational chaos persists
- Perfect weather + 2,632 disruptions = OPERATIONAL FAILURE, not weather
✈️ AIRPORTS IN CRISIS (RANKED BY DISRUPTIONS)
1. Chicago O’Hare (ORD): 168 Delays + 6 Cancellations = 174 Total (DELAY CAPITAL!)
Total Disruptions: 174 flights
Cancellation Rate: 3.4%
Delay Rate: 96.6% (virtually all disruptions are delays!)
Passengers Affected: 22,500-28,000
Why O’Hare Leads Nation in Delays:
- Sheer volume: O’Hare handles 900-1,000 daily flights, ANY backlog creates massive delay counts
- Hub dependency: United’s 2nd-largest hub, American’s 3rd-largest hub = when Chicago fails, networks collapse
- Aircraft out of position: Planes scheduled for Chicago stuck in NYC, Boston, Philadelphia for 5 days
- Crew exhausted: Pilots/FAs hit FAA duty limits, need 10+ hour rest, creating crew shortages
- Zero operational slack: O’Hare at 95%+ capacity pre-blizzard, NO ability to absorb disruptions
Routes Most Affected:
- Chicago → New York (all 3 airports): United/American delays 60-120 min
- Chicago → Boston: United/American delays (Boston = 2nd-worst cancellation hub)
- Chicago → Atlanta: United/Delta delays (Atlanta = 2nd-worst delay hub)
- Chicago → Los Angeles: United/American cross-country delays
- Chicago → Small Midwest cities: Regional carrier delays (Republic, SkyWest)
Why This Matters:
- 168 delays = 18-19% of O’Hare daily schedule
- O’Hare = US aviation chokepoint — when Chicago fails, entire Midwest fails
- Business travel impact: Same-day Chicago-NYC, Chicago-DC, Chicago-SF trips impossible
- Economic impact: $2.2-2.7M per day (lost productivity, missed meetings)
2. Atlanta Hartsfield-Jackson (ATL): 144 Delays + 2 Cancellations = 146 Total
Total Disruptions: 146 flights
Cancellation Rate: 1.4%
Delay Rate: 98.6% (virtually all disruptions are delays!)
Passengers Affected: 19,000-24,000
Why World’s Busiest Airport Can’t Recover:
- 104M annual passengers = NO margin for error — ANY delay cascades instantly
- Delta’s primary hub: 70% of ATL flights are Delta, when Delta struggles = ATL fails
- Connecting passenger backlog: Thousands still rebooking from Sunday-Monday chaos
- Aircraft repositioning: Delta planes stuck in NYC/Boston for 5 days, can’t reach Atlanta
Routes Most Affected:
- Atlanta → New York (JFK/LaGuardia/Newark): Delta delays (NYC still recovering)
- Atlanta → Boston: Delta/JetBlue delays
- Atlanta → Chicago: Delta/United delays (Chicago = delay capital)
- Atlanta → Los Angeles: Delta cross-country delays
- Atlanta → Caribbean/Latin America: Connecting passenger delays affecting Cancun, Punta Cana, Cartagena
Why This Matters:
- 144 delays = 11-13% of ATL daily schedule
- ATL = world’s busiest airport — when Atlanta fails, GLOBAL aviation network affected
- Delta hub: 70% of ATL = Delta means Delta network nationwide disrupted
- International connections: European, Asian, Latin American passengers missing Atlanta connections
3. Boston Logan (BOS): 18 Cancellations + 112 Delays = 130 Total (HIGHEST CANCELLATIONS!)
Total Disruptions: 130 flights
Cancellation Rate: 13.8% (HIGHEST among major hubs!)
Delay Rate: 86.2%
Passengers Affected: 17,000-21,000
Why Boston Still Cancelling Flights (Day 5):
- JetBlue hub: Boston = JetBlue’s largest hub, JetBlue = highest cancellation carrier Day 5
- Regional airport collapse: Nantucket (14 cancels), Martha’s Vineyard (11 cancels), Barnstable (10 cancels) = Boston-feeding routes dead
- Northeast epicenter: Boston received 20-30 inches snow Sunday-Monday, infrastructure still recovering
- International connections: London, Toronto, Montreal, Caribbean routes affected
Routes Most Affected:
- Boston → New York (LaGuardia): JetBlue cancellations/delays
- Boston → Nantucket/Martha’s Vineyard/Barnstable: Cape Cod/Islands ISOLATED (35 total cancellations at 3 regional airports!)
- Boston → Washington DC (Reagan): JetBlue/Delta cancellations
- Boston → Orlando: JetBlue delays (Florida vacation routes)
- Boston → Toronto: Air Canada delays (connects to Canada Day 58 crisis)
Why This Matters:
- 18 cancellations = HIGHEST among major hubs (Day 5)
- 13.8% cancel rate = systemic failure (normal = <1%)
- New England island isolation: Nantucket, Martha’s Vineyard, Barnstable have ZERO alternative transport (no ferries winter, no bridges)
- Medical emergencies: Cape Cod residents relying on air medical transport STRANDED
4. Newark Liberty (EWR) + JFK International: 207 Combined Delays (NYC METRO BACKLOG)
Newark Liberty:
- Delays: ~100-120 (exact count unclear from sources)
- Cancellations: Single digits (<5)
JFK International:
- Delays: ~80-100 (exact count unclear from sources)
- Cancellations: Single digits (<5)
Combined NYC Metro Impact:
- 207 total delays across Newark + JFK
- LaGuardia (separate data): Unknown Day 5 specifics but historically worst NYC airport
Why NYC Metro Can’t Recover:
- Blizzard epicenter: NYC received 19-23 inches, LaGuardia/JFK/Newark ALL shut down 36+ hours
- Aircraft stuck: Hundreds of planes parked at gates for 2 days, now repositioning chaos
- Crew shortage: Pilots/FAs stranded in hotels, exhausted, hitting duty limits
- United’s #1 hub (Newark): When Newark fails, United’s entire network fails
- International gateway: JFK = primary Europe/Asia/Latin America gateway, delays affect global travelers
5. San Francisco (SFO): 100 Delays (WEST COAST CHAOS!)
Total Disruptions: 100+ delays (cancellations minimal)
Cause: Low cloud ceilings (NOT blizzard-related, separate weather event)
Delay Rate: ~12-15% of SFO daily schedule
Why West Coast Added to East Coast Nightmare:
- Separate weather event: San Francisco experiencing low clouds/visibility (marine layer)
- Ground delay advisory: FAA slowing arrivals due to visibility <3 miles
- Compounds East Coast chaos: Passengers connecting SFO → East Coast now face DOUBLE delays
- Tech hub impact: San Francisco = Silicon Valley access, business travel disrupted
Routes Affected:
- SFO → NYC (JFK/Newark): Delays both ends (SFO weather + NYC recovery)
- SFO → Boston: Delays both ends
- SFO → Chicago: Delays (ORD = delay capital)
- SFO → Los Angeles: Intra-California delays
Why This Matters:
- 100 delays = East Coast chaos spreading to West Coast
- Perfect storm: West Coast weather + East Coast recovery = nationwide gridlock
- Tech industry: San Francisco delays affect Apple, Google, Meta, Salesforce business travel
6-10. Mountain & Regional Airports:
Aspen (ASE): Increasing Arrival Delays
- Cause: Wind (mountainous terrain + high altitude = sensitive to wind)
- Impact: Ski resort access disrupted, wealthy travelers stuck
- Economic: Aspen = $500-1,000/night hotels, private jet cancellations
Steamboat Springs (HDN): Ground Delay (Volume)
- Cause: Airport volume (small airport overwhelmed)
- Impact: Colorado ski resort isolation
Nantucket Memorial (ACK): 14 Cancellations (WORST IN US!)
- Impact: Island completely isolated, no ferry service winter
- Medical emergencies: Nantucket Hospital relying on air medical, medevac only option
Martha’s Vineyard (MVY): 11 Cancellations
- Impact: Island isolation continues, residents stranded
Barnstable Municipal (HYA): 10 Cancellations
- Impact: Cape Cod regional airport, feeds Boston Logan
🛫 AIRLINES IN CRISIS (RANKED BY IMPACT)
1. United Airlines: Estimated 80-100 Cancellations + 600-800 Delays
Total Disruptions: 680-900 flights
Passengers Affected: 88,000-117,000
Why United Hit Hardest:
- Newark = #1 hub (shut down 36+ hours Sunday-Monday, still recovering Day 5)
- Chicago = #2 hub (168 delays today = delay capital)
- San Francisco = #3 hub (100 delays today = West Coast chaos)
- Hub-and-spoke model: When 3 major hubs fail, entire United network collapses
Routes Most Affected:
- Newark → Everywhere: Aircraft stuck in NYC for 5 days
- Chicago → NYC: Both hubs failing = compounding delays
- San Francisco → NYC: West Coast + East Coast chaos = 4-6 hour delays
2. Delta Air Lines: Estimated 60-80 Cancellations + 500-700 Delays
Total Disruptions: 560-780 flights
Passengers Affected: 73,000-101,000
Why Delta Struggling:
- Atlanta = #1 hub (144 delays today)
- Boston = major hub (JetBlue competition, Delta delays)
- LaGuardia/JFK: Delta strong presence in NYC, recovering Day 5
- Connects to Feb 23 crisis: Delta had 346 cancellations Feb 23 (technical glitch), network still unstable
3. American Airlines: Estimated 50-70 Cancellations + 400-600 Delays
Total Disruptions: 450-670 flights
Passengers Affected: 59,000-87,000
Why American Affected:
- Chicago = #3 hub (168 delays today)
- Philadelphia = #4 hub (98% shutdown Feb 24, still recovering)
- Dallas/Fort Worth = #1 hub (1,000+ miles from blizzard BUT ripple effects: 170 delays Feb 26)
- CEO crisis: Feb 11 no-confidence vote = crew morale low, operational strain high
4. Endeavor Air (Delta Connection): Estimated 10-15 Cancellations + 50-80 Delays
Total Disruptions: 60-95 flights
Passengers Affected: 4,800-7,600
Why Endeavor Failing:
- Regional carrier vulnerability: Small aircraft, thin margins, zero backup capacity
- LaGuardia/JFK collapse: Endeavor operates heavily from NYC
- Connects to Feb 24: Endeavor had 381 cancellations Feb 24 (100% LaGuardia/JFK shutdown)
5. Spirit Airlines: Estimated 5-10 Cancellations + 30-50 Delays
Total Disruptions: 35-60 flights
Passengers Affected: 5,300-9,000
Why Spirit Struggling:
- Bankruptcy operational death spiral: Chapter 11 since Nov 2024
- Fort Lauderdale hub: Ripple from Northeast affecting Florida operations
- Low-cost = low reliability: Spirit has fewest spare aircraft/crews
6-10. Other Affected Airlines:
Alaska Airlines: 20-30 delays (West Coast operations, SFO weather)
Southwest Airlines: 63 cancellations + 164 delays (Feb 26 data, Day 5 likely similar)
Air Canada: Multiple delays (Toronto, Montreal, Vancouver connecting to US = Canada Day 58 crisis)
JetBlue: 20 cancellations + 66 delays (Boston hub = highest cancel rate)
Republic Airways: 50-80 delays (regional carrier crisis, Chicago/NYC operations)
🌨️ ROOT CAUSE ANALYSIS: WHY DAY 5 = STILL CHAOS
The Blizzard Ended 5 Days Ago — Why Still Broken?
Winter Storm Hernando (February 22-23, 2026):
- Sunday-Monday: 19-38 inches of snow across Northeast
- 8,300+ flights cancelled (Sunday-Monday combined)
- Airports shut 36+ hours: LaGuardia, JFK, Newark, Boston, Philadelphia
Today’s Perfect Weather (February 27, 2026):
- New York: 35°F (2°C), sunny, 8 MPH winds, clear skies
- Chicago: 30°F (-1°C), clear, light winds
- Atlanta: 58°F (14°C), sunny, perfect flying
- Boston: 32°F (0°C), clear skies
- San Francisco: 55°F (13°C), low clouds (separate weather, NOT blizzard)
Why Perfect Weather Doesn’t Fix This:
1. Aircraft Out of Position (Physical Problem):
- Example: Plane scheduled for Chicago → LA on Thursday was supposed to arrive Chicago from Newark on Sunday → Newark cancelled Sunday → Plane still in Newark on Thursday → Chicago flight cancelled/delayed
- Scale: Hundreds of aircraft in wrong cities for 5 days
- Solution time: 3-7 days to reposition all aircraft back to correct cities
2. Crew Out of Position (Human Problem):
- Example: Pilot scheduled for Atlanta → Miami Thursday was supposed to fly Newark → Atlanta Sunday → Newark cancelled Sunday → Pilot stuck in Newark hotel 5 days → Atlanta flight has no pilot
- FAA duty limits: Pilots can work 8-9 hours/day MAX, then 10+ hour rest required
- Exhaustion: Crews working 16-hour days Sunday-Tuesday, now hitting cumulative fatigue limits
- Solution time: 5-10 days for crews to rest, reposition, resume normal schedules
3. Connecting Passenger Backlog (Operational Problem):
- Sunday-Monday: 8,300 flights cancelled = 1.1-1.3 MILLION passengers stranded
- Rebooking: Each passenger needs new flight → limited seats → cascade delays
- Standby lists: Thousands on standby for every flight, trying to get home
- Solution time: 7-14 days for all stranded passengers to reach destinations
4. Maintenance Backlog (Technical Problem):
- De-icing fluid residue: Planes sat in snow/ice for 48 hours, need cleaning
- Aircraft inspections: Post-winter storm, FAA requires full aircraft checks
- Equipment damage: Snow plows hit airport equipment, ground vehicles damaged
- Solution time: 5-7 days for full maintenance catch-up
5. Airport Infrastructure Maxed Out (Systemic Problem):
- Gate shortage: LaGuardia, JFK, Newark ALL at 95%+ gate usage pre-blizzard
- No spare gates: When extra flights arrive (delayed from Sunday-Monday), no gates available
- Tarmac delays: Planes land but sit on tarmac 30-90 min waiting for gates
- Solution: NONE (requires building new gates = years)
🔗 CUMULATIVE IMPACT (FEB 22-27): 6 DAYS OF CHAOS
Day-by-Day Breakdown:
Sunday, February 22:
- Preemptive cancellations: 2,000+ flights cancelled in advance
Monday, February 23:
- Blizzard peak: 8,300+ cancellations nationwide
- LaGuardia: 1,034 cancellations (99.7% cancel rate)
- Philadelphia: 605 cancellations (98% shutdown)
- Boston: 439 cancellations (85% of schedule)
- Newark: Complete shutdown 36+ hours
- Delta technical glitch: 346 cancellations + 578 delays
- Fort Lauderdale: 334 disruptions
- Tampa: 162 disruptions
- Toronto Pearson: 491 disruptions
Tuesday, February 24:
- Recovery Day 1 FAILED:
- Endeavor Air: 381 cancellations nationwide (100% LaGuardia/JFK)
- American Airlines: 613 cancellations
- Philadelphia: 605 cancellations (near-total shutdown continues)
- PSA Airlines: 200 cancellations
Wednesday, February 25:
- Recovery Day 2 STRUGGLING:
- LaGuardia: 449 cancellations + 119 delays (568 disruptions, 83% cancel rate)
- Republic Airways: 164 LaGuardia cancellations (37% of airport total)
- Buffalo: 57 disruptions
Thursday, February 26:
- Recovery Day 3 (actually Day 4) STILL FAILING:
- 2,100+ nationwide disruptions
- LaGuardia: 364 disruptions (38 cancellations + 326 delays)
- Atlanta: 200+ delays
- Chicago: 232+ disruptions (87 cancellations + 145 delays)
- Boston: 300 disruptions (71 cancellations + 229 delays)
- Newark: 181 delays + 9 cancellations
- Charlotte: 101 delays + 4 cancellations
- Dallas/Fort Worth: 170 delays + 4 cancellations
- Reagan National: 15 cancellations + 127 delays
TODAY — Friday, February 27:
- Recovery Day 4 (actually Day 5) STILL BROKEN:
- 2,632 nationwide disruptions ← TODAY’S STORY
- Chicago O’Hare: 168 delays + 6 cancellations (DELAY CAPITAL)
- Atlanta: 144 delays + 2 cancellations
- Boston Logan: 18 cancellations + 112 delays (HIGHEST CANCEL RATE)
- Newark + JFK: 207 combined delays
- San Francisco: 100 delays (West Coast chaos)
- Nantucket: 14 cancellations (WORST IN US)
- Martha’s Vineyard: 11 cancellations
- Barnstable: 10 cancellations
CUMULATIVE IMPACT (Feb 22-27):
- 20,000+ total US disruptions (6-day period)
- 2.5+ million passengers affected
- $1.2+ billion economic impact (lost productivity, hotel costs, rebooking)
- ZERO full recovery — Day 5 still 2,632 disruptions
🌍 IMPACT ON TIER 1 TRAVELERS
United States Travelers
Direct Impact:
- 340,000-420,000 affected TODAY (Day 5)
- 2.5+ million affected this week (Feb 22-27)
- Business travelers: Thursday meetings missed, conference calls from airports
- Family travelers: Spring Break planning chaos (trips in 15 days!)
- Ski resort travelers: Aspen, Steamboat Springs delays (peak ski season)
Cities Most Affected:
- Chicago — 168 delays = business travel nightmare
- Atlanta — 144 delays = world’s busiest airport failing
- Boston — 18 cancellations = highest cancel rate
- New York — Newark + JFK 207 delays = NYC metro backlog
- San Francisco — 100 delays = West Coast added to East Coast chaos
What This Means:
- Day 62 of US aviation crisis (since January 1, 2026)
- No recovery in sight — Spring Break in 15 days, system already broken
- Regional carrier collapse — Nantucket, Martha’s Vineyard, Barnstable isolated
- Government shutdown — TSA/ATC unpaid, service degrading
UK Travelers
Indirect Impact:
- Transatlantic connections: London → New York → US cities disrupted
- British Airways, Virgin Atlantic: LHR-JFK/EWR delays affect onward US travel
- Example: London → Newark (arrives on time) → Chicago (delayed 3 hours) = UK traveler stuck in Newark
Routes Affected:
- LHR → JFK: Multiple delays (JFK = part of NYC 207-delay metro backlog)
- LHR → EWR: United delays (Newark hub strain)
- LHR → BOS: British Airways/Virgin Atlantic delays (Boston 18 cancels)
- LHR → ORD: British Airways/American delays (Chicago = delay capital)
Canadian Travelers
Direct Impact:
- Air Canada flights to US: Toronto-NYC, Montreal-Boston, Vancouver-SF ALL delayed
- Cross-border chaos: Canada Day 58 aviation crisis (your Feb 26 article) + US Day 5 chaos = double whammy
- Air Canada Unifor strike: Contract expires TOMORROW (February 28) = preemptive cancellations
Compounding Factors:
- Toronto Pearson: Connecting to US flights delayed (both ends)
- Calgary/Vancouver: Air Canada/WestJet delays affecting US routes
- Spring Break overlap: Canadian March Break (March 7-13) + US Spring Break (March 14-22)
Australian Travelers
Minimal Direct Impact:
- Very few Australians connect through US East Coast hubs (most use LAX, SFO)
- IF connecting: Sydney → LA (Qantas) → New York → Europe = affected by NYC delays
- San Francisco: 100 delays today = Qantas connections to East Coast delayed
💡 TRAVELER SURVIVAL GUIDE
If You’re Flying TODAY (Feb 27) or Weekend (Feb 28-March 1):
1. Check Status Every 30 Minutes:
- Use airline app (push notifications)
- Check FlightAware, FlightRadar24 (real-time tracking)
- Sign up for text alerts
2. Arrive EXTRA Early:
- Domestic flights: 3-4 hours early (vs. normal 2 hours)
- International flights: 4-5 hours early (vs. normal 3 hours)
- Why: TSA checkpoints slower (DHS shutdown), rebooking lines long, gate changes frequent
3. Avoid Chicago, Atlanta, Boston, NYC:
- Alternative routes: Direct flights better than connections through these hubs
- Example: If flying LA → Miami, book DIRECT (don’t connect through Atlanta, Chicago, NYC)
4. Have Backup Plans:
- Alternative airports: NYC area? Consider Philadelphia or Hartford (less chaos)
- Alternative airlines: If United, consider Delta/American (though all struggling)
- Alternative dates: If non-essential, delay travel to next week (March 3-7)
5. Minimum Connection Times:
- Normal: 1-2 hours sufficient
- TODAY: 4-6 hours minimum (delays cascading all day)
- Example: Atlanta connection? Arrive 6+ hours before next flight
Understanding Your Rights:
Weather Cancellations:
- Airlines owe you: Rebooking on next available flight OR full refund
- Airlines do NOT owe you: Hotels, meals, ground transportation
Operational Cancellations (Crew/Aircraft Issues):
- Airlines owe you: Rebooking, meals, hotels (if overnight), ground transportation
- How to tell: If airline says “crew scheduling” or “aircraft availability” = operational
Day 5 = Operational, NOT Weather:
- Perfect weather today = cancellations/delays are OPERATIONAL
- Airlines SHOULD pay compensation (meals, hotels, etc.)
- BUT: Airlines will claim “weather-related” to avoid paying
If You’re Stuck at Airport RIGHT NOW:
Chicago O’Hare (168 Delays!):
- Hotels 95%+ full (everyone stranded)
- Prices surging: $300-600/night
- Try: Downtown Chicago (more availability, Blue Line train to airport)
- Food: Terminal 1 (McDonald’s, Frontera Grill), Terminal 3 (PF Chang’s)
- Sleeping: Yoga room Terminal 3 (quiet, limited spots)
Atlanta (144 Delays!):
- Hotels 90%+ full
- Minute Suites: Paid sleep pods $40-80 for 4-8 hours
- Food: Chick-fil-A, Popeyes (multiple concourses)
- Sleeping: Concourse T (international) has quiet seating
Boston Logan (18 Cancels + 112 Delays!):
- Hotels 95%+ full
- Try: Downtown Boston (Uber/taxi 20-30 min to airport)
- Food: Terminal B (Legal Sea Foods, Sam Adams, Dunkin’)
- Sleeping: Terminal E (international) overnight seating
📊 SYSTEMIC CRISIS: WHY SPRING BREAK = APOCALYPSE
Spring Break 2026 (March 14-22):
The Numbers:
- 40+ million Americans traveling domestically
- 60% demand surge above normal (schools off, families vacation)
- Peak days: March 14-16 (outbound), March 21-22 (return)
Current System Status (Feb 27):
- Day 5 post-blizzard: 2,632 disruptions with PERFECT weather
- System broken: Aircraft out of position, crews exhausted, maintenance backlog
- NO recovery: 5 days and still failing
What Happens When 40M Travelers Hit Broken System?
Best Case Scenario:
- Airlines achieve full recovery by March 1 (unlikely)
- Spring Break proceeds with normal disruptions (5-10% delays)
- System handles 60% surge
Likely Scenario:
- System still broken March 14
- 60% surge overwhelms already-failing infrastructure
- 20-30% of flights delayed/cancelled
- Millions stranded at airports
- Hotel prices surge 200-300%
- Rental cars sold out
- Airports gridlocked for 7-10 days
Worst Case Scenario:
- System still broken + additional weather events (March storms)
- 40-50% of flights delayed/cancelled
- Nationwide aviation shutdown (similar to Dec 2022 Southwest meltdown)
- DOT intervention, Congressional hearings
- Airlines lose $5-10 billion
Compounding Factors:
- DHS shutdown: 61,000 TSA agents unpaid, security checkpoints degrading
- Air Canada strike: Feb 28 contract expires (TOMORROW!), US-Canada routes affected
- Regional carrier collapse: Republic, PSA, Endeavor proving unable to recover
- Infrastructure limits: Airports at 95%+ capacity, zero slack
When Will This Actually Get Better?
Short-Term (Feb 28-March 7):
- Weekend (Feb 28-March 1): Expect continued 1,500-2,000+ delays/day
- Next week (March 3-7): Gradual improvement IF no more weather
- Best case: Full recovery by March 7 (unlikely)
- Realistic: 50-70% recovery by March 14 (Spring Break begins)
Long-Term (2026-2027):
- Spring Break (March 14-22): Apocalypse scenario (system will fail)
- Summer (June-August): Continued chaos (World Cup adds stress)
- 2027: Maybe recovery if airlines invest in spare capacity (unlikely)
What Needs to Happen (Won’t Happen):
- Airlines hire 20-30% more pilots/FAs: Creates spare capacity for weather events
- Airports build 20-30% more gates: Reduces gate shortage bottleneck
- Government action: TSA pay increase, ATC hiring surge, FAA funding
- Reality: None of this will happen, system stays broken
🔗 OFFICIAL GOVERNMENT RESOURCES
FAA Flight Delay Information:
US Department of Transportation – Air Travel Consumer Report:
TSA Wait Times:
- TSA MyTSA App
- Real-time security checkpoint wait times, current airport conditions
📰 RELATED TRAVEL TOURISTER ARTICLES
Recent US Chaos Coverage:
Northeast Blizzard Coverage:
Last Updated: February 27, 2026 at 3:00 PM EST
Recovery Timeline: Airlines targeting March 1-2 “near-normal” operations (unlikely given Day 5 performance)
Next Major Event: Air Canada Unifor strike deadline TOMORROW February 28 (affects US-Canada routes)
Spring Break: March 14-22, 2026 (15 days away)
Posted By : Vinay
As a lead contributor for Travel Tourister, Vinay is dedicated to serving our Tier 1 audience (US, UK, Canada, Australia). His mission is to deliver precise, fact-checked news and actionable, data-driven articles that empower readers to make informed decisions, minimize travel risks, and maximize their adventure without compromising safety or budget.
 Call
Call Enquiry