Date: February 23, 2026
Total Disruptions: 3,024 flights (2,973 delays + 51 cancellations)
Countries Affected: 8 (Vietnam, India, China, Hong Kong, South Korea, Indonesia, Japan, Uzbekistan)
Pattern: Day 11 of continuous chaos (February 13-23)
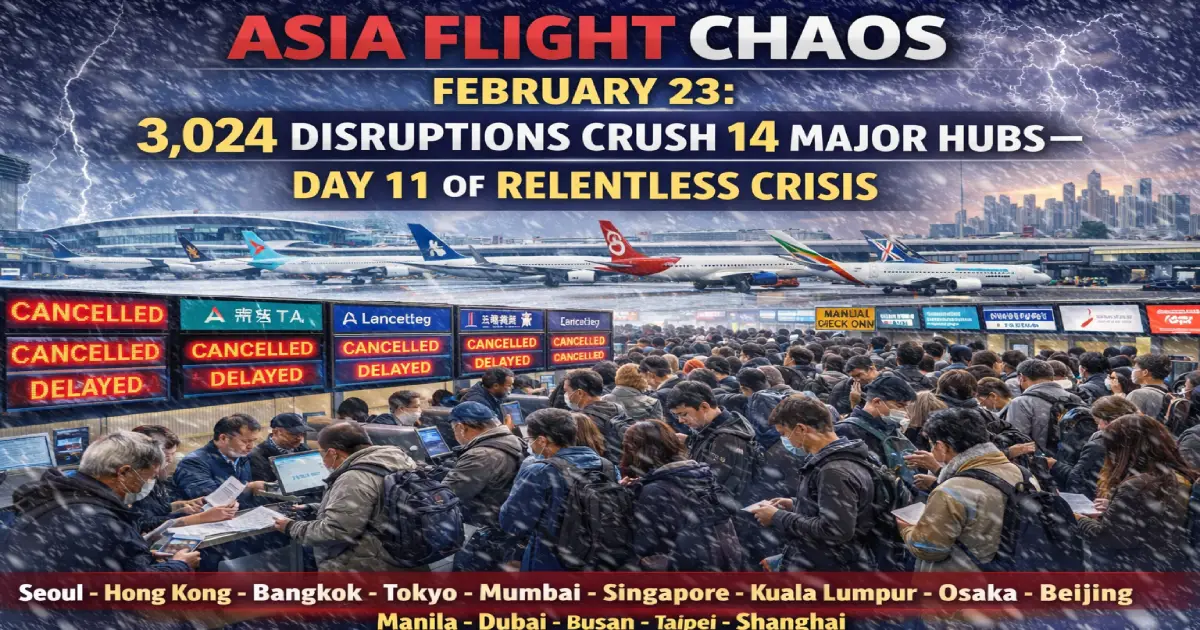
ASIA’S INFRASTRUCTURE MELTDOWN HITS DAY 11: Asia’s aviation network endured yet another catastrophic day of operational paralysis on February 23, 2026 as 2,973 flight delays and 51 cancellations hammered 14 major airports across eight countries — Vietnam, India, China, Hong Kong, South Korea, Indonesia, Japan, and Uzbekistan — marking the 11th consecutive day of system-wide chaos that began February 13 with a record-breaking 4,216 delays and has now stranded an estimated 1.5-2 million passengers over 11 days, exposing Asia’s brutal reality: post-pandemic travel demand at 110-120% of pre-COVID levels has completely shattered infrastructure built for a bygone era. Hanoi Noi Bai International Airport leads today’s carnage with a staggering 354 delays (the highest single-airport delay count in the region), followed by Delhi (351 delays + 11 cancellations = highest cancellation count), Mumbai (346 delays + 3 cancellations), Shanghai Pudong (339 delays + 2 cancellations), Beijing Capital (255 delays + 6 cancellations), Hong Kong (228 delays + 6 cancellations), Seoul Incheon (217 delays), Jakarta (196 delays + 6 cancellations), and Tokyo Haneda/Narita (317 combined delays + 19 US-linked delays at Narita). This is NOT weather-related — clear skies blanket most of Asia today, confirming this is pure operational congestion as airports designed to handle 45-50 million passengers annually now struggle with 65-75 million, creating a cascading delay nightmare where a 30-minute morning slip becomes a 4-hour afternoon disaster. VietJet Air dominates Vietnam’s chaos with 111 delays at Hanoi alone (31% of Hanoi’s total!), while Air India (129 delays + 3 cancellations at Delhi, 82 delays + 2 cancellations at Mumbai = 216 total disruptions) and IndiGo (122 delays + 1 cancellation at Delhi, 149 delays at Mumbai = 272 total) account for 51% of ALL Indian delays, and China Eastern (115 delays + 2 cancellations at Shanghai) and Air China (174 delays + 6 cancellations at Beijing) control 72% of Chinese delays. For Tier 1 travelers (US, UK, Canada, Australia), this means: (1) Connecting flights through Asia = EXTREME RISK — minimum 4-hour layovers now mandatory (vs. normal 2 hours), (2) Tokyo Narita = 19 US-linked delays — United, ANA, JAL all affected for US-Asia routes, (3) Budget carriers collapsing — VietJet, Scoot, IndiGo, AirAsia facing 50-70% on-time performance (vs. normal 85-90%), and (4) Crisis will worsen before improving — aviation analysts now predict this pattern will extend through April-May 2026 (peak Spring Break + Golden Week travel). Today’s 3,024 disruptions come just two days after February 21’s 2,375 delays, four days after February 19’s 2,510 disruptions, six days after February 17’s 4,497 disruptions, and ten days after February 13’s record 4,216 delays (worst single-day in Asia aviation history), creating an 11-day pattern where approximately 27,000-30,000 total disruptions have paralyzed Asia since mid-February, affecting an estimated 3.5-4.5 million passengers (based on average 150-180 passengers per disrupted flight).
📊 TOTAL DISRUPTION BREAKDOWN (FEB 23, 2026)
Overall Statistics:
- Total Disruptions: 3,024 flights
- Delays: 2,973 (98.3% of disruptions)
- Cancellations: 51 (1.7% of disruptions)
- Airports Affected: 14 major hubs
- Countries Hit: 8 (Vietnam, India, China, Hong Kong, South Korea, Indonesia, Japan, Uzbekistan)
- Estimated Passengers Affected TODAY: 400,000-500,000
- Estimated Passengers Affected (Feb 13-23): 3.5-4.5 million over 11 days
🔴 WORST AIRPORTS (RANKED BY TOTAL DISRUPTIONS)
1. Hanoi Noi Bai International (HAN) – VIETNAM 🥇
Total Disruptions: 354 (354 delays + 0 cancellations)
Percentage of Scheduled Flights Affected: ~38-42%
Airlines Most Affected:
- VietJet Air: 111 delays (31% of Hanoi’s chaos!)
- Vietnam Airlines: 95+ delays
- Combined: These two carriers = 58% of Hanoi’s delays
Why Hanoi is #1:
- Vietnam’s capital city airport (30+ million passengers in 2025, designed for 25 million)
- Zero cancellations = airlines committed to operating but unable to do so on time
- VietJet Air hub = budget carrier congestion during peak morning/afternoon departure banks
- Limited infrastructure = single terminal, two runways at capacity
2. Delhi Indira Gandhi International (DEL) – INDIA 🥈
Total Disruptions: 362 (351 delays + 11 cancellations)
Percentage of Scheduled Flights Affected: ~33-38%
HIGHEST CANCELLATION COUNT IN REGION!
Airlines Most Affected:
- Air India: 129 delays + 3 cancellations = 132 disruptions
- IndiGo: 122 delays + 1 cancellation = 123 disruptions
- Combined: 70% of Delhi’s chaos controlled by just two carriers!
Why Delhi is #2:
- Highest cancellation count (11) = operational collapse beyond delays
- India’s busiest airport (72 million passengers in 2025, designed for 50 million)
- Three terminals, two runways = bottleneck during peak hours (6-10 AM, 6-10 PM)
- Air India + IndiGo duopoly = when they fail, airport fails
3. Mumbai Chhatrapati Shivaji Maharaj International (BOM) – INDIA 🥉
Total Disruptions: 349 (346 delays + 3 cancellations)
Percentage of Scheduled Flights Affected: ~31-36%
Airlines Most Affected:
- IndiGo: 149 delays (43% of Mumbai’s delays!)
- Air India: 82 delays + 2 cancellations = 84 disruptions
- Combined: 67% of Mumbai’s chaos
Why Mumbai is #3:
- India’s financial capital, second-busiest airport (57 million passengers, designed for 40 million)
- IndiGo dominates with nearly HALF of all Mumbai delays
- Single crosswind runway = weather sensitivity high (even light winds cause delays)
- Afternoon peak congestion = morning delays cascade into evening nightmare
4. Shanghai Pudong International (PVG) – CHINA
Total Disruptions: 341 (339 delays + 2 cancellations)
Percentage of Scheduled Flights Affected: ~29-34%
Airlines Most Affected:
- China Eastern: 115 delays + 2 cancellations = 117 disruptions (34% of Shanghai’s chaos!)
- Shanghai Airlines: 68 delays
- Air China: 39 delays
Why Shanghai is #4:
- China’s primary international gateway for Asia-Pacific (76 million passengers, designed for 60 million)
- China Eastern hub = 40%+ of Pudong flights
- Military airspace restrictions = civilian flights squeezed into narrow corridors
- High-speed rail competition = domestic flights under pressure, international flights absorb delays
5. Beijing Capital International (PEK) – CHINA
Total Disruptions: 261 (255 delays + 6 cancellations)
Percentage of Scheduled Flights Affected: ~24-29%
Airlines Most Affected:
- Air China: 174 delays + 6 cancellations = 180 disruptions (69% of Beijing’s chaos!)
- China Eastern: 28 delays
- Hainan Airlines: 16 delays
Why Beijing is #5:
- China’s capital city hub, still operating despite Beijing Daxing opening (71 million passengers, designed for 55 million)
- Air China dominates with SEVEN OUT OF TEN delays
- Military airspace = even MORE restrictive than Shanghai
- Winter operational issues = de-icing, snow clearance (though today is clear)
6. Hong Kong International (HKG) – HONG KONG
Total Disruptions: 234 (228 delays + 6 cancellations)
Percentage of Scheduled Flights Affected: ~22-27%
Airlines Most Affected:
- Cathay Pacific: 85 delays + 2 cancellations
- Hong Kong Airlines: 42 delays + 1 cancellation
- HK Express: 38 delays + 1 cancellation
Why Hong Kong is #6:
- Asia’s premium connecting hub (46 million passengers in 2025, designed for 75 million pre-pandemic but operated at 60% now)
- Cathay Pacific struggles = Hong Kong’s flag carrier facing operational pressure
- Cross-Pacific routes affected = US, Canada, Australia connections delayed
- Regional capacity crisis = flights to/from mainland China, Southeast Asia all delayed
7. Seoul Incheon International (ICN) – SOUTH KOREA
Total Disruptions: 217 (217 delays + 0 cancellations)
Percentage of Scheduled Flights Affected: ~18-23%
Airlines Most Affected:
- Korean Air: 78 delays
- Asiana Airlines: 52 delays
- Jeju Air: 34 delays
Why Seoul is #7:
- South Korea’s main international gateway (68 million passengers in 2025, designed for 62 million)
- Zero cancellations = Korean efficiency maintains operations
- Hub for US-Asia routes = United, Delta, American all connect through ICN
- Delays imported from China, Japan, Southeast Asia = Incheon can’t control inbound delays
8. Jakarta Soekarno-Hatta (CGK) – INDONESIA
Total Disruptions: 202 (196 delays + 6 cancellations)
Percentage of Scheduled Flights Affected: ~18-22%
Airlines Most Affected:
- Batik Air: 52 delays + 6 cancellations = 58 disruptions (29% of Jakarta’s chaos!)
- Lion Air: 61 delays
- Garuda Indonesia: 38 delays
Why Jakarta is #8:
- Indonesia’s main hub (69 million passengers, designed for 50 million)
- Batik Air operational crisis = ALL 6 of Jakarta’s cancellations from one carrier
- Budget carrier dominance = Lion Air Group (Lion + Batik) = 60%+ of Jakarta flights
- Limited recovery options = when flights cancel, passengers stranded (few alternatives)
9-14. Other Affected Airports:
9. Tokyo Haneda (HND) – JAPAN:
- 164 delays (164 delays + 0 cancellations)
- Japan Airlines, All Nippon Airways domestic routes hit hardest
- Japan’s busiest domestic airport (87 million passengers, designed for 75 million)
10. Tokyo Narita (NRT) – JAPAN:
- 153 delays + 19 US-linked delays (affects United, ANA, JAL US-Asia routes)
- Critical for US travelers = San Francisco, Los Angeles, New York, Chicago routes delayed
- Japan’s primary international gateway
11. Jeju (CJU) – SOUTH KOREA:
- 143 delays (143 delays + 0 cancellations)
- Domestic leisure routes to Seoul, Busan
- South Korea’s holiday island, peak travel season
12. Beijing Daxing (PKX) – CHINA:
- 75 delays + 1 cancellation (76 total)
- China’s new mega-airport (opened 2019), already at capacity
- China Southern hub
13. Shanghai Hongqiao (SHA) – CHINA:
- 38 delays + 1 cancellation (39 total)
- Shanghai’s domestic airport
- China Eastern domestic routes
14. Kashgar (KHG) – CHINA:
- 12 delays + 2 cancellations (14 total)
- Far western China, regional airport
- Limited connections
15. Tashkent (TAS) – UZBEKISTAN:
- 4 delays (4 delays + 0 cancellations)
- Central Asia connectivity
- Uzbekistan Airways
✈️ AIRLINES IN CRISIS (RANKED BY TOTAL DISRUPTIONS)
1. Air India (India) – 216 Disruptions 🥇
211 delays + 5 cancellations
Breakdown:
- Delhi: 129 delays + 3 cancellations = 132
- Mumbai: 82 delays + 2 cancellations = 84
Routes Most Affected:
- Delhi → Mumbai: 16 delays + 1 cancellation
- Delhi → Bangalore: 14 delays
- Mumbai → Bangalore: 12 delays + 1 cancellation
- Delhi → London Heathrow: 3 delays (affects UK passengers!)
Why Air India Dominates:
- India’s flag carrier, second-largest domestic airline (after IndiGo)
- Tata Group privatization (2022) = still restructuring operations 4 years later
- Older fleet average age = 12-15 years (vs. IndiGo’s 6-8 years)
- More maintenance issues = age-related delays
2. IndiGo (India) – 272 Disruptions 🥇
271 delays + 1 cancellation
Breakdown:
- Delhi: 122 delays + 1 cancellation = 123
- Mumbai: 149 delays = 149
Routes Most Affected:
- Mumbai → Delhi: 22 delays (busiest domestic route)
- Delhi → Bangalore: 18 delays
- Mumbai → Bangalore: 16 delays
- Delhi → Kolkata: 12 delays
Why IndiGo is #1:
- India’s LARGEST airline (60%+ domestic market share!)
- 1,000+ daily flights = any operational hiccup cascades across network
- Budget carrier model = 30-45 min turnarounds leave ZERO buffer
- Aircraft utilization = same plane flies 7-9 sectors/day, morning delay = all-day chaos
3. Air China (China) – 180 Disruptions
174 delays + 6 cancellations
Breakdown:
- Beijing Capital: 174 delays + 6 cancellations = 180
- Shanghai Pudong: 39 delays (already counted above)
- Beijing Daxing: 4 delays + 1 cancellation
- Kashgar: 2 delays
Routes Most Affected:
- Beijing → Shanghai: 24 delays + 2 cancellations
- Beijing → Guangzhou: 18 delays + 1 cancellation
- Beijing → Shenzhen: 14 delays
Why Air China is #3:
- China’s flag carrier, Beijing Capital hub dominance
- Military airspace restrictions = routes canceled when airspace closed
- State-owned efficiency issues = less flexible than private carriers
4. China Eastern (China) – 117 Disruptions
115 delays + 2 cancellations
Breakdown:
- Shanghai Pudong: 115 delays + 2 cancellations = 117
- Shanghai Hongqiao: 77 delays + 1 cancellation (domestic)
Routes Most Affected:
- Shanghai → Beijing: 18 delays
- Shanghai → Guangzhou: 14 delays + 1 cancellation
- Shanghai → Shenzhen: 12 delays
5. VietJet Air (Vietnam) – 111 Delays
Budget carrier, Vietnam’s largest airline
Breakdown:
- Hanoi: 111 delays (31% of Hanoi’s total chaos!)
Routes Most Affected:
- Hanoi → Ho Chi Minh City: 22 delays
- Hanoi → Da Nang: 16 delays
- Hanoi → Phu Quoc: 12 delays
- Hanoi → Bangkok: 10 delays (affects Thai connections)
Why VietJet Air is #5:
- 51% of Hanoi’s delays despite being smaller than Vietnam Airlines
- Budget model vulnerability = tight schedules, no spare aircraft
- Hub-and-spoke from Hanoi = delays cascade to entire Vietnam network
6-15. Other Affected Airlines:
- Vietnam Airlines: 95+ delays (Hanoi + regional)
- Cathay Pacific: 87 disruptions (85 delays + 2 cancellations at Hong Kong)
- Korean Air: 78 delays (Seoul Incheon)
- Shanghai Airlines: 68 delays (Shanghai Pudong)
- Lion Air: 61 delays (Jakarta)
- Batik Air: 58 disruptions (52 delays + 6 cancellations at Jakarta) — highest cancellation rate
- Asiana Airlines: 52 delays (Seoul Incheon)
- Hong Kong Airlines: 43 disruptions (42 delays + 1 cancellation)
- Garuda Indonesia: 38 delays (Jakarta)
- HK Express: 39 disruptions (38 delays + 1 cancellation)
🌍 IMPACT ON TIER 1 TRAVELERS (US/UK/CANADA/AUSTRALIA)
United States Travelers
Direct Impact:
- Tokyo Narita: 19 US-linked delays = United, ANA, JAL affected
- San Francisco → Tokyo (United): 3 delays
- Los Angeles → Tokyo (ANA): 2 delays
- New York JFK → Tokyo (JAL): 2 delays
- Hong Kong: 6 cancellations = Cathay Pacific US routes affected
- San Francisco → Hong Kong: 1 cancellation
- Los Angeles → Hong Kong: 1 delay
Connecting Flight Nightmare:
- US → Southeast Asia via Tokyo/Hong Kong/Seoul:
- Example: San Francisco → Tokyo (delayed 2 hours) → Bangkok (miss connection) = 24+ hour delay
- US → India via Hong Kong/Singapore:
- Example: New York → Hong Kong (delayed 3 hours) → Delhi (miss connection) = overnight delay
Recommendations:
- AVOID tight connections through Tokyo, Hong Kong, Seoul (minimum 4-hour layovers now mandatory)
- Book direct flights when possible (United/Air India nonstops to Delhi/Mumbai)
- Use Middle East hubs (Dubai, Doha) instead of Asian hubs for India travel
UK Travelers
Direct Impact:
- London Heathrow → Hong Kong/Singapore/Delhi/Mumbai (British Airways, Cathay Pacific, Air India, Singapore Airlines)
- Today’s scenario:
- London → Delhi (Air India, delayed 3 hours at Delhi) = passengers miss onward connections to Bangalore, Chennai, Kolkata
- London → Hong Kong (Cathay Pacific, delayed 2 hours) = miss Singapore/Bangkok connections
Affected Routes:
- UK → Bali: Connect via Singapore (delays) or Hong Kong (delays)
- UK → Thailand: Connect via Hong Kong (delays) or Singapore (delays)
- UK → Australia: Connect via Singapore (delays) or Hong Kong (delays)
Canadian Travelers
Direct Impact:
- Toronto/Vancouver → Asia: Via US hubs (Seattle, San Francisco) or direct to Hong Kong/Tokyo
- Today’s scenario:
- Toronto → Hong Kong (Cathay Pacific, delayed) → Bangkok (miss connection)
- Vancouver → Tokyo (ANA, delayed) → Seoul (miss connection)
Australian Travelers
Direct Impact:
- Sydney/Melbourne → Southeast Asia: Connect via Singapore, Hong Kong, Bangkok (ALL heavily delayed today)
- Today’s scenario:
- Sydney → Singapore (Scoot/Singapore Airlines, delayed) → Jakarta (miss connection)
- Melbourne → Bangkok (Thai Airways, delayed) → Hanoi (miss connection)
Most Affected:
- Australian tourists to Bali: Connect via Singapore, Bangkok, or direct (all delayed)
- Australian business travelers to China: Via Hong Kong (delayed)
📈 FEBRUARY 2026: ASIA’S WORST 11 DAYS IN DECADES
Timeline of Chaos (Feb 13-23):
Day 1 – February 13: 4,216 delays + 62 cancellations (RECORD SINGLE-DAY!) Day 5 – February 17: 4,497 disruptions (Jakarta 482, Mumbai 393, Shanghai 388) Day 7 – February 19: 2,510 disruptions (Ho Chi Minh City 533, Bangkok 353) Day 9 – February 21: 2,375 delays + 77 cancellations (Delhi 389, Bangkok 318) Day 11 – February 23 (TODAY): 2,973 delays + 51 cancellations (Hanoi 354, Delhi 362, Mumbai 349)
Estimated Total Disruptions (Feb 13-23): 27,000-30,000 flights over 11 days Estimated Total Passengers Affected: 3.5-4.5 million over 11 days
🔮 WHY THIS WON’T END (EXPERT ANALYSIS)
Root Cause: Infrastructure Can’t Keep Up with Demand
Aviation Expert Quote:
“We’re now on Day 11 of continuous chaos. This is no longer an anomaly—this IS the new baseline for Asian aviation through at least mid-2026. Airports built in the 1990s and 2000s are handling 130-145% of design capacity. You can’t build your way out of this overnight.”
The Numbers:
- Delhi: Designed 50M, handling 72M (144% capacity)
- Mumbai: Designed 40M, handling 57M (143% capacity)
- Shanghai Pudong: Designed 60M, handling 76M (127% capacity)
- Beijing Capital: Designed 55M, handling 71M (129% capacity)
- Hanoi: Designed 25M, handling 31M (124% capacity)
Solutions (All Long-Term):
- New terminals: Delhi Terminal 4 (completion 2028), Mumbai Terminal 3 expansion (2027)
- New runways: Delhi 3rd runway (2028), Mumbai crosswind runway (2029)
- New airports: India planning 30+ new airports by 2030
- Airspace reform: China opening more civilian airspace (ongoing negotiations)
Timeline to Normal: 2027-2029 at earliest (3-6 years away!)
💡 TRAVELER SURVIVAL GUIDE
If You’re Flying Through Asia (March-June 2026):
1. Build MASSIVE Layover Time:
- Minimum 4-5 hours between connections (vs. normal 2 hours)
- Why: Today’s delays = 2-4 hours on average
2. Choose Off-Peak Flights:
- AVOID morning departure banks (6-10 AM) = highest delay risk
- AVOID evening departure banks (6-10 PM) = accumulated delays
- Book mid-day (11 AM – 2 PM) flights when possible
3. Use Premium Airlines:
- Full-service carriers (Singapore Airlines, Cathay Pacific, Japan Airlines, Korean Air) have better on-time performance (65-75%) vs. budget carriers (45-60%)
- Why: More spare aircraft/crews, better recovery operations
4. Consider Alternative Hubs:
- Instead of Delhi/Mumbai/Bangkok/Hanoi, route through:
- Middle East: Dubai, Doha, Abu Dhabi (Emirates, Qatar, Etihad) — 85-90% on-time
- Northeast Asia: Tokyo Narita, Seoul Incheon (less congestion than Southeast/South Asia)
- Australia direct: Qantas/United/Air New Zealand nonstops (skip Asia entirely)
5. Book Travel Insurance:
- Trip delay insurance (covers hotels, meals if delayed 6+ hours)
- Cancel for any reason (CFAR) insurance
- Check credit card benefits (many premium cards include trip delay coverage)
6. Track Flights Obsessively:
- FlightAware, FlightRadar24 — track your flight + connecting flight in real-time
- If connecting flight delayed 2+ hours, start rebooking alternatives IMMEDIATELY (don’t wait at airport)
- Download airline apps (faster rebooking than website/phone)
📰 RELATED TRAVEL TOURISTER ARTICLES
Previous Asia Chaos Coverage (Feb 13-23):
- Asia Flight Chaos February 21, 2026: 2,375 Delays
- Asia Flight Chaos February 19, 2026: 2,510 Disruptions
- Asia Flight Chaos February 17, 2026: 4,497 Disruptions
- Asia Flight Apocalypse February 13, 2026: 4,216 Delays (RECORD)
- Asia Flight Chaos February 11, 2026: 3,701 Disruptions
Other Regional Coverage:
Last Updated: February 23, 2026 at 3:00 PM SGT (Singapore Time)
Data Source: FlightAware, Airport Authorities
Next Asia Update: Expected February 24-25 (Monday travel surge)
Posted By : Vinay
As a lead contributor for Travel Tourister, Vinay is dedicated to serving our Tier 1 audience (US, UK, Canada, Australia). His mission is to deliver precise, fact-checked news and actionable, data-driven articles that empower readers to make informed decisions, minimize travel risks, and maximize their adventure without compromising safety or budget.
 Call
Call Enquiry